Reading: Information Security Tools and Practices: What Works?
Information Security Tools and Practices: What Works?
See discussions, stats, and author profiles for this publication at: https://www.researchgate.net/publication/3044784
Information Security Tools and Practices: What Works?.
Article in IEEE Transactions on Computers · September 2004
DOI: 10.1109/TC.2004.45 · Source: IEEE Xplore
1 author:
![]() Julie
J. C. H. Ryan Wyndrose Technical Group
Julie
J. C. H. Ryan Wyndrose Technical Group
37 PUBLICATIONS 384 CITATIONS
All content following this page was uploaded by Julie J. C. H. Ryan on 15 July 2014.
Information Security Tools and Practices: What Works?
Julie J.C.H. Ryan
Abstract—Much effort has been expended characterizing the threats and vulnerabilities associated with information security. The next step, analyzing experiences using security practices and tools, provides insight into what works and what appears to be unused or ineffective. This paper presents a brief analysis of data gathered from small businesses in the US regarding their experiences and practices. While the use of security-related tools is limited, there are some clear indicators that emerge from the analysis. Two critical inferences are that restrictive access control practices work to reduce problems and that the use of tools is related to a higher incident rate of problems. This may mean that those who experience problems are more likely to invest in control mechanisms.
Index Terms—Information security, computer security, access control, security technologies, best business practices, current business practices.
![]()
![]()
1 INTRODUCTION
BOTH the US and the global economies are embracing a knowl- edge-based approach to business, which has given rise to such specialties as knowledge management, data warehousing, and data mining. Integration of enterprises in strategic alignments contributes to a diffusing of boundaries both in network terms and in data stewardship responsibilities. It follows, naturally, that concern with how information security is practiced is rising. With every network connection, the reach of a hostile agent becomes broader. The extent of interconnectivity of systems is such that computer viruses can sweep the globe much like the influenza biological virus. As a result, poor security practices at a few companies can have worldwide impact. A particularly attention- getting example of this relationship is seen in the effects of distributed denial of service attacks on electronic commerce activities [1].
Managers attempting to understand how to best allocate scarce resources for security purposes are stymied by lack of coherent, scientifically valid, and timely data [2]. Efforts to understand both the state of security practices and the scope of the problem have been attempted, with varied results. It is necessary to describe the experiences and practices of businesses with regard to information security elements in order to understand the state of information security. Most of the attempts to do so, however, have not been rigorously defined scientific efforts and have resulted in statisti- cally meaningless data—in other words, data that is worthless for anything other than anecdotes. At best, what is presented by the published surveys is a glimpse of the problem space that must be used with some care.
This research was undertaken in order to answer the following question: What information security practices produce results in real world business environments? In order to have a tractable problem, the research target population was limited to small businesses.
● The author is with the School of Engineering and Applied Sciences, George Washington University, Washington, DC .
E-mail: julieryan@julieryan.com.
Manuscript received 8 Feb. 2002; revised 13 Aug. 2003; accepted 23 Dec.
2003.
For information on obtaining reprints of this article, please send e-mail to: tc@computer.org, and reference IEEECS Log Number 115867.
2 METHOD FOR COLLECTING DATA
In order to be useful, data must be collected from an appropriately sized sample of individual businesses in a method that eschews bias and fairly represents the entire population. Furthermore, the data must truly represent the state of experience and practices in each individual enterprise and the experiences and practices of each business must not be represented more than once in the survey data. It is difficult to accomplish this goal with large, multinational corporations. When multiple parties from the same firm participate in a survey, the analyzed data potentially magnifies the effects of problems or incidents. However, in the smallest of small businesses, one person can legitimately be assumed to know the experiences and practices of the respondent organization. Therefore, when this research was planned, the target population was selected as small businesses in the US.
Small businesses represent an impressive slice of the
US economy. According to the US Small Business Administration Office of Advocacy, small businesses employ more than half of workers (53 percent) and produce more than half of the US gross domestic product (51 percent) [3]. So, an analysis of small business security practices is much more than a simple way to get a glimpse at overall security practices—it is an analysis of the security practices of a significant fraction of the US economic base.
2.1 Participant Selection
The small businesses selected to participate in this research were chosen randomly. In total, 741 small businesses located in 45 states were contacted and asked to complete a questionnaire. Useable responses were received from 209 separate businesses in 33 states. With a total population of small businesses in the US numbering in excess of five million, this sample size provides a confidence interval of 6.78 at the 95 percent confidence level.
2.2 Research Design
The survey instrument was prepared using best practices of survey design and was tested rigorously to ensure that the instrument was valid both in content and in construct. The survey instrument contained 11 questions in three groups. The design of the questionnaire was limited to provide absolute anonymity to respondents. No traceability is possible between a response and a responder due to both design controls and process controls. The instrument featured 110 variables in the survey data structure.
2.3 Responses Received
The responses were received from businesses representing agriculture, manufacturing, transportation, finance, real estate, retail, sanitary, construction, wholesale, communications, and services. Of these areas, 56.6 percent of the responses were from services firms, which corresponds well to the general nature of the US economy. The fractional split in terms of the Standard Industrial Code (SIC) identification schema is shown in Fig. 1. The vast majority of respondents use computers in their businesses. Only two respondents reported not having computers. Most of the respondents, 72.7 percent, reported having between one and five computers for the business. Less than 10 percent reported using more than 21 computers.
The experiences and concerns expressed by the respondents provide insight into their security-related activities. The most common experiences reported by the respondents were data corruption, problems with viruses or other malicious software, and problems with reliability of information systems. The highest levels of concern were indicated for problems with viruses, data availability, data integrity, transaction integrity, software integrity,
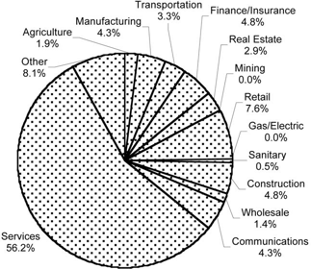
Fig. 1. Percentage of respondents by Standard Industrial Code (SIC) identifier.
and power failure. The respondents were least concerned about insider access abuse, fraud, natural disaster, outsider access abuse, data sabotage, and data theft.
Understanding whether or not the respondents were sensitive to the need to protect data can provide some context in which to analyze their use of various strategies or tools related to information security. The most important data to the respondents was customer data, while other kinds of data, such as privacy data, proprietary data, market data, and competitive data, were rated as being of moderate importance. Somewhat surprisingly, trade secrets were indicated as being of moderate to low importance. The reason this is surprising is that the SBA reports that small businesses account for 55 percent of innovations and patents [4], which would indicate the presence of trade secrets in more than a few small businesses.
3 THE PRACTICES
It is a tenet of sound security that policy and controls limit potential damage by accidental or malicious attacks. In order to provide this context to the question of what works, the respondents were asked to describe their practices in the areas of access privilege management, management tool usage, and technology tool usage.
3.1 Access Privilege Management
A majority of respondents, 57.4 percent, indicated that they allow full-time employees to use computers and networks in the business. Fewer respondents, 17.2 percent and 6.7 percent, respectively, provide part-time employees or temporary employ- ees with the privilege of using the firm’s computers and networks. The percentage of respondents granting access privileges to contractors, customers, and e-commerce partners was 6.7 percent,
6.2 percent, and 1.9 percent, respectively. Almost one fourth of respondents, 24.4 percent, indicated that access privileges were granted to family members and friends.
3.2 Management Tool Usage
The most frequently reported management tool, data recovery procedures, was reported by 39.7 percent of the respondents. Interestingly, the most common problem, reported by 28.7 percent of the respondents, was having data get corrupted or lost. The relationship between these two elements is not independent. Those respondents who reported having data corrupted or lost were more likely to have procedures for data recovery (30.1 percent versus
27.8 percent) and those respondents who reported having data recovery procedures in place were less likely to have experienced data corruption or loss (41.7 percent versus 58.3 percent).
The next most commonly reported management tool was an information security policy, with 30.6 percent reporting having
one. Fewer than 25 percent of the respondents reported having computer or communications use and misuse policies, business continuity plans, computer emergency response plans, or media destruction procedures. On average and considering all types of policies, only 42 percent of the respondents reported having a written information security policy of any kind.
3.3 Technology Tool Usage
The use of technology tools is more common than the use of management tools. More than 70 percent of the respondents reported using antivirus software, data back-up systems, system access controls, and power surge protectors. Less than 50 percent reported using all other types of technologies, including redundant systems, shredders, firewalls, and encryption. Fewer than 25 per- cent reported using technologies such as intrusion detection systems, system activity monitors, facility access controls, security evaluation systems, dial back modems, and media degaussers.
For the 87.1 percent of respondents indicating use of antivirus software, most updated the virus definitions “occasionally.” Weekly or monthly updates were reported by 24.2 percent and
25.3 percent, respectively. Fewer respondents reported updating the virus definitions on an annual basis—8.8 percent—and even fewer, 6.6 percent, reported never updating them. Of the
75.1 percent of respondents indicating the use of data backup systems, only 34 total respondents (16.3 percent) use off-site storage of the data backups. Additionally, the majority of data backup capabilities were characterized as being manual rather than automatic. However, the most frequently reported redundant system was data storage systems. The most commonly used system access control reported was passwords and, for 64.5 percent of the respondents, that was the only system access control used.
4 SEARCHING FOR MEANING
The data was examined to see if discernible relationships exist between access control practices and the incident rate of problems. The data was also analyzed to see if businesses that experience more problems were more likely to use technology or management tools.
4.1 Access Practices and Experiences
Access control is a critical element in constructing a secure environment. An analysis of this data indicates that weaker access control practices are associated with a greater likelihood of problems and that more restrictive access control practices are associated with fewer reported problems.
4.1.1 Identifying Relationships
For all of the access privileges granted, the strongest relation- ships identified were with the experiences of having had data get corrupted or lost, having had problems with viruses, and with having had an information security related incident (not further defined).
The most common problems were associated with giving part- time employees access to computers and networks. Giving all full- time employees, contractors, and temporary employees access is also related to having more problems, particularly with regard to malicious software. Fig. 2 shows this data graphically. The data shows the percentage of respondents reporting any incident separated by access practice. The data points are connected by lines to visually link them. The only group that had a higher percentage of respondents reporting having experienced no problems were those who limited access to employees only and then only for job-related activities. Part-time and temporary employees are correlated with the abuse of internet connectivity, while contractors are strongly correlated with insider access abuse incidents.
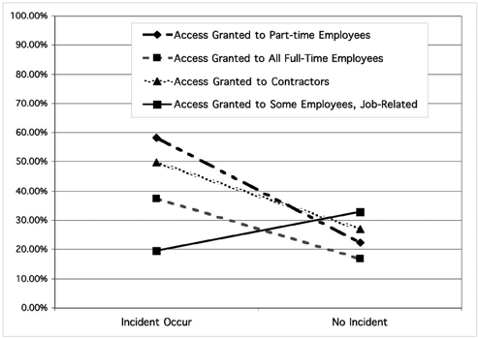
Fig. 2. Percentage of respondents reporting incidents by access practice.
Somewhat surprisingly, giving access to family members and friends is not related to either any specific incident type or to having experienced any problems in aggregate. It is logical to question whether it is a matter of not providing access in great enough numbers to actually be able to determine such a relation- ship, but, in fact, access was provided to family and friends more frequently (24.4 percent) than to every other category except all full-time employees (57.4 percent).
Interestingly, providing access to e-commerce partners is strongly related to both theft of computers and having had secret data divulged. Perhaps not coincidentally, participating in e-commerce is also related to using both management tools (policies and procedures) and technology tools.
4.1.2 The Nature of the Relationships
The nature of the relationship between providing access and incident rates of identified problems is, for the most part, positive. In other words, those respondents providing access to all full-time employees, part-time employees, contractors, temporary employ- ees, and e-commerce partners are more likely to experience an identified problem than those respondents not providing that type of access.
However, there are relationships which are inverse and these are more interesting because of their implications. For example, those respondents who only provide access to computers and networks based on job requirements are less likely to experience virus problems or data corruption or loss.
Another set of relationships that is interesting is based on respondents giving access to customers. In this situation, the respondents are much less likely to report having problems with system reliability. They are, however, more likely to report having problems with viruses or having information security incidents in general.
The data associated with the meaningful relationships is presented in Fig. 3. It shows the percentages of respondents having either experienced a specific type of problem or not associated with the access control practice.
4.2 Experiences and Technology Tool Use
The data was examined to determine the experiences of the respondents against their reported uses of technology tools.
4.2.1 Identifying Relationships
There are some interesting relationships reported in the use of technologies and having experienced one or more problem in the previous 12 months. Having experienced data corruption or loss
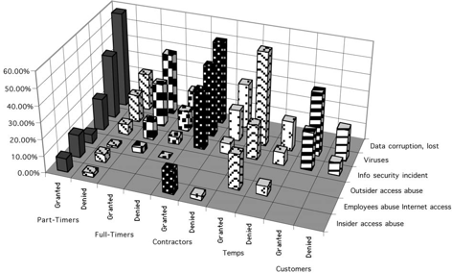
Fig. 3. Percentage of respondents reporting incidents, distinguished between those granting and denying access to specific categories of people.
and the use of seven technology types—firewalls, data segregation, encryption, facility access controls, redundant systems, media degaussers, and data backup systems—are related. Similarly, having had a problem with viruses or other malicious software is associated with the use of eight technology types (anti-virus S/W, data segregation, firewalls, facility access controls, redun- dant systems, system activity monitors, shredders, and data backup systems). Similarly, having had reliability problems is correlated with the use of six technology types (data segregation, facility access controls, redundant systems, media degaussers, power surge protectors, and data backup aystems). Interestingly, while some relationships make intuitive sense, such as the use of data segregation controls and having had data corrupted or lost, some do not, such as the use of media degaussers and having had data corrupted or lost.
4.2.2 The Nature of the Relationships
Having identified the meaningful relationships, comparisons were made between the two groups—those using the specified technology tool and those not using it—and the percentage of respondents indicating that they had experienced the specified problem in the previous 12 months. In all cases, those respondents indicating the use of a technology tool were more likely to also indicate having experienced a given problem.
This may indicate that those respondents were more aware of potential problems and were looking for incidences or it may indicate that previous experiences with problems had spurred them to invest in the technologies. It is impossible to determine causal relationships from this data. Fig. 4 shows graphically the difference between those using a specific technology and the incident rate of information security problems.
4.3 Experiences and Management Tool Use
Technology tools are not the only things available to managers to use in controlling the problems that may occur. There are also management tools that can be used to control the environment and to create a framework of protection, detection, and reaction activities to support the security goals. Respondents were asked to identify which management tools they used. The following section presents an analysis of the data looking for relationships between reported experiences and management tool usage.
4.3.1 Identifying Relationships
Similarly to the relationships between experiences and technology use, there are some interesting relationships both present and absent between experiences and management tool use. For example, having had employees abuse the Internet is not associated with the use of any particular management tool. However, having had problems with viruses is associated with
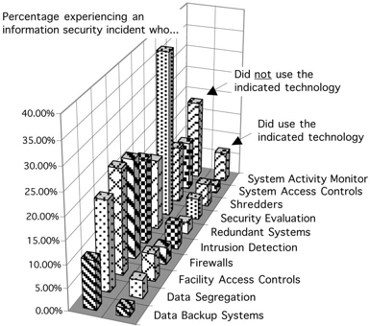
Fig. 4. Percentage of respondents having experienced an information security incident, distinguished between those who used specific technologies and those who did not use the technology.
seven different management tools. Having had a problem with data corruption or loss is associated with having information security procedures and a computer emergency response team, but not with having data recovery procedures.
Having experienced reliability problems is correlated with having information security, data destruction procedures, and media destruction procedures, but not with having business continuity plans, computer emergency response plans or teams, or data recovery procedures.
Having experienced an information security incident (not further defined) is associated with all given management tools except proprietary data use and misuse policies and business continuity plans. Having experienced fraud is associated with information security policies, computer use and misuse policies, data destruction procedures, and having computer emergency response teams.
Having had an insider abuse access privileges is associated with computer use and misuse policies, information security procedures, and media destruction procedures. Having had computers stolen is associated with information security policies and business continuity plans.
Having had an outsider abuse access is associated strongly with media destruction procedures and less strongly with information security policies. Having had secret data divulged is associated with computer emergency response plans, communications and computer use and misuse policies, and possibly with proprietary data use and misuse policies. Having had proprietary data stolen is not associated with any management tool except media destruc- tion procedures.
4.3.2 The Nature of the Relationships
Having identified correlated relationships, the data was then examined to identify the nature of the relationship. Once again, the respondents who indicated the use of a specific management tool were also more likely to have experienced an identified problem. In some cases, the incident rates were significantly higher, such as in the case of the use of media destruction procedures and the relevant problem areas. Fig. 5 presents a graphical comparison of the incident rate of information security problems between those who use and do not use the identified tool.
5 CONCLUSIONS
Conclusions concerning causal associations are not possible based on this data, naturally, but the inferences that can be drawn from
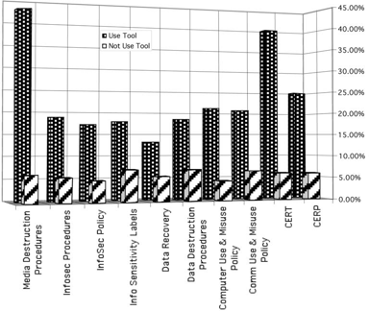
Fig. 5. Percentage of respondents having experienced an information security incident, distinguished between those who used specific tools and those who did not use the tool.
the use or lack of use of common tools associated with a holistic approach to information security are instructive.
This research was designed to investigate the practices of small businesses with regard to information security. It achieved that goal, but, in the process, uncovered many more questions. There seems to be only a small influence on behavior exerted by experience—what, then, is influencing behavior? Is it educational levels, advertising, or other social effects? Further research must be performed to discover the influencing factors.
Looking for relationships between information security solu- tions, both managerial and technological, and experiences reveals that those using tools are more likely to report having experienced problems. This could be because they had a problem and invested in the controls. Alternatively, it could be that they are looking for the problems and actually notice the problem when it occurs or it could reflect an increased level of risk in their environments. More research is needed to identify the influencing and causal elements in these relationships.
It is clear, based on this research, that the current state of information security practice in small business is spotty at best. Low percentages of respondents report using even commonly available technologies, with the exception of antivirus software and password protection on systems. Advertising and other cultural influences may be powerful determinants in this, as may well be the availability and ease of use. Individual backgrounds may also be determinants. With the increased level of education regarding all information technology issues and with its increasing ubiquity, the penetration of more powerful information technol- ogies into even the smallest of the small businesses is likely.
Further research is required to identify and explain why small businesses adopt some management tools but not others, why they use some technologies but not others, and how their experiences affect how they operate. Future research focused on organizational behavior influences may shed additional light on causalities in information security within business enterprises.
REFERENCES
[1] J. Kerstetter and J. Madden, “Web Attacks Raise Chilling Questions for IT,” Zdnet eWeek, 11 Feb. 2000, http://www.zdnet.com/eweek/stories/ general/0,11011,2436607,00.html.
[2] J.J.C.H. Ryan and T.I. Jefferson, “The Use, Misuse, and Abuse of Statistics in Information Security Research,” Proc. 2003 ASEM Nat’l Conf. 2003.
[3] Small Business Administration, “Small Business Administration Frequently Asked Questions,” http://www.sba.gov/, Oct. 1999.
[4] Small Business Administration, “Small Business Answer Card,”Office of Advocacy Small Business Answer Card, http://www.sba.gov/advo/ stats/ec_anscd.html, Nov. 1999.
Modifié le: lundi 13 juin 2022, 12:56