Reading: Lesson 2 - Asset Management Ratios & Debt Management Ratios
3.2.A - Asset Management Ratios & Debt Management Ratios
1. Debt Management Ratios
- The extent to which a firm uses debt financing is called financial leverage. Here are three important implications: (1) Stockholders can control a firm with smaller investments of their own equity if they finance part of the firm with debt. (2) If the firm’s assets generate a higher pre-tax return than the interest rate on debt, then the shareholders’ returns are magnified, or “leveraged.” Conversely, shareholders’ losses are also magnified if assets generate a pre-tax return less than the interest rate. (3) If a company has high leverage, even a small decline in performance might cause the firm’s value to fall below the amount it owes to creditors. Therefore, a creditor’s position becomes riskier as leverage increases. Keep these three points in mind as you read the following sections.
- A firm's two primary types of debt are notes payable and long-term bonds, but more complicated companies also might report the portion of long-term debt due within a year, the value of capitalized leases, and other types of obligations that charge interest. A firm's, total debt may be:
![]()
Is this too much debt, not enough, or the right amount? To answer this question, we begin by calculating the percentage of a firm’s assets that are financed by debt. The ratio of total debt to total assets is called the debt-to-assets ratio. It is sometimes shortened to the debt ratio.4 Total debt is the sum of all short-term debt and long-term debt; it does not include other liabilities.
3. A firm’s debt ratio is:
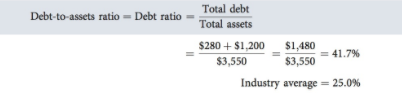
This firm’s debt ratio is 41.7%, which is substantially higher than the 25% industry average.
4. The debt-to-equity ratio is defined as:
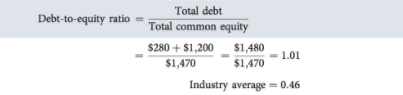
The debt-to-equity ratio shows that this firm has $1.01 of debt for every dollar of equity, whereas the debt ratio shows that 41.7% of the firm's assets are financed by debt. We find it more intuitive to think about the percentage of the firm that is financed with debt, so we usually use the debt ratio.
5. Sometimes it is useful to express debt ratios in terms of market values. It is easy to calculate the market value of equity, which is equal to the stock price multiplied by the number of shares. This firm's market value of equity is $27(50) = $1,350. Often it is difficult to estimate the market value of debt, so many analysts use the debt reported in the financial statements. The market debt ratio is defined as:
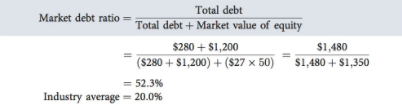
This firm's market debt ratio in the previous year was 36.1%. The big increase was due to two major factors: Debt increased and the stock price fell. The stock price reflects a company’s prospects for generating future cash flows, so a decline in stock price indicates a likely decline in future cash flows. Thus, the market debt ratio reflects a source of risk that is not captured by the conventional debt ratio.
6. The liabilities-to-assets ratio is defined as:

2. Ability to Pay Interest: Times-Interest- Earned Ratio
- The times-interest-earned (TIE) ratio, also called the interest coverage ratio, is determined by dividing earnings before interest and taxes by the interest expense:

The TIE ratio measures the extent to which operating income can decline before the firm is unable to meet its annual interest costs. Failure to meet this obligation can bring legal action by the firm’s creditors, possibly resulting in bankruptcy. Note that earnings before interest and taxes, rather than net income, is used in the numerator. Because interest is paid with pre-tax dollars, the firm’s ability to pay current interest is not affected by taxes.
3. Ability to Service Debt: EBITDA Coverage Ratio
- The TIE ratio is useful for assessing a company’s ability to meet interest charges on its debt, but this ratio has two shortcomings: (1) Interest is not the only fixed financial charge— companies must also reduce debt on schedule, and many firms lease assets and thus must make lease payments. Failure to repay debt or meet lease payments may force them into bankruptcy. (2) EBIT (earnings before interest and taxes) does not represent all the cash flow available to service debt, especially if a firm has high depreciation and/or amortization charges. A better coverage ratio would take into account the “cash” earnings and the other financial charges. This firm had $500 million of EBIT and $200 million in depreciation, for an EBITDA (earnings before interest, taxes, depreciation, and amortization) of $700 million. Also, lease payments of $28 million were deducted while calculating EBIT. That $28 million was available to meet financial charges; hence it must be added back, bringing the total available to cover fixed financial charges to $728 million. Fixed financial charges consisted of $120 million of interest, $20 million of sinking fund payments, and $28 million for lease payments, for a total of $168 million. This firm’s EBITDA coverage ratio is:
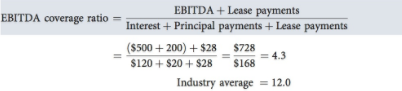
This firm covered its fixed financial charges by 4.3 times. The firm’s ratio is well below the industry average, so again the company seems to have a relatively high level of debt. The EBITDA coverage ratio is most useful for relatively short-term lenders such as banks, which rarely make loans (except real estate-backed loans) for longer than about 5 years. Over a relatively short period, depreciation-generated funds can be used to service debt. Over a longer time, those funds must be reinvested to maintain the plant and equipment or else the company cannot remain in business. Therefore, banks and other relatively short-term lenders focus on the EBITDA coverage ratio, whereas long-term bondholders focus on the TIE ratio.
Última modificación: martes, 14 de agosto de 2018, 08:39