Reading: Lesson 3 - Risk in a Portfolio Context
6.3.A- Risk in a Portfolio Context
1. Risk in a Portfolio Context
- Most financial assets are actually held as parts of portfolios. Banks, pension funds, insurance companies, mutual funds, and other financial institutions are required by law to hold diversified portfolios. Even individual investors—at least those whose security holdings constitute a significant part of their total wealth—generally hold portfolios, not the stock of only one firm.
- A portfolio is a collection of assets. The weight of an asset in a portfolio is the percentage of the portfolio’s total value that is invested in the asset. For example, if you invest $1,000 in each of 10 stocks, your portfolio has a value of $10,000, and each stock has a weight of $1,000/$10,000 = 10%. If instead you invest $5,000 in 1 stock and $1,000 apiece in 5 stocks, the first stock has a weight of $5,000/$10,000 = 50%, and each of the other 5 stocks has a weight of 10%. Usually it is more convenient to talk about an asset’s weight in a portfolio rather than the dollars invested in the asset. Therefore, when we create a portfolio, we choose a weight (or a percentage) for each asset, with the weights summing to 1.0 (or the percentages summing to 100%).
- Suppose we have a portfolio of n stocks. The actual return on a portfolio in a particular period is the weighted average of the actual returns of the stocks in the portfolio, with wi denoting the weight invested in Stock i:


The average portfolio return over a number of periods is also equal to the weighted average of the stock’s average returns:
![]()
![]()
Recall from the previous section that SnailDrive had an average annualized return of 8.6% during the past 48 months and MicroDrive had a 14.6% return. A portfolio with 75% invested in SnailDrive and 25% in MicroDrive would have had the following return:
![]()
![]()
Notice that the portfolio return of 10.1% is between the returns of SnailDrive (8.6%) and MicroDrive (14.6%), as you would expect. Suppose an investor with stock only in SnailDrive came to you for advice, saying “I would like more return, but I hate risk!” How do you think the investor would react if you suggested taking 25% of the investment in the low-risk SnailDrive (with a standard deviation of 25.8%) and putting it into the high-risk MicroDrive (with a standard deviation of 49.2%)? As shown above, the return during the 48 month period would have been 10.1%, well above the return on SnailDrive. But what would have happened to risk?
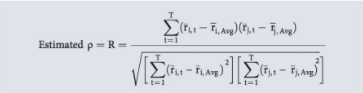
4. The tendency of two variables to move together is called correlation, and the correlation coefficient measures this tendency. The symbol for the correlation coefficient is the Greek letter rho, ρ (pronounced roe). The correlation coefficient can range from +1.0, denoting that the two variables move up and down in perfect synchronization, to −1.0, denoting that the variables always move in exactly opposite directions. A correlation coefficient of zero indicates that the two variables are not related to each other at all—that is, changes in one variable are independent of changes in the other. The estimate of correlation from a sample of historical data is often called “R.” Here is − the formula to estimate the correlation between stocks i and j (ri,t is the actual return for Stock i in period t, and −r i,Avg is the average return during the T-period sample; similar notation is used for stock j):

If two stocks have a correlation of −1 (the lowest possible correlation), when one stock has a higher than expected return then the other stock has a lower than expected return, and vice versa. In fact, it would be possible to choose weights such that one stock’s deviations from its mean return completely cancel out the other stock’s deviations from its mean return. Such a portfolio would have a zero standard deviation but would have an expected return equal to the weighted average of the stock’s expected returns. In this situation, diversification can eliminate all risk: For correlation of −1, the portfolio’s standard deviation can be as low as zero if the portfolio weights are chosen appropriately. If the correlation were +1 (the highest possible correlation), the portfolio’s standard deviation would be the weighted average of the stock’s standard deviations. In this case, diversification doesn’t help: For correlation of +1, the portfolio’s standard deviation is the weighted average of the stocks’ standard deviations. For any other correlation, diversification reduces, but cannot eliminate, risk: For correlation between −1 and +1, the portfolio’s standard deviation is less than the weighted average of the stocks’ standard deviations. The correlation between most pairs of companies is in the range of 0.2 to 0.3, so diversification reduces risk, but it doesn’t completely eliminate risk.
5. The figure above shows how portfolio risk is affected by forming larger and larger portfolios of randomly selected New York Stock Exchange (NYSE) stocks. Standard deviations are plotted for an average one-stock portfolio, an average two-stock portfolio, and so on, up to a portfolio consisting of all 2,000-plus common stocks that were listed on the NYSE at the time the data were plotted. The graph illustrates that, in general, the risk of a portfolio consisting of large-company stocks tends to decline and to approach some limit as the size of the portfolio increases. According to data from recent years, σ1, the standard deviation of a one-stock portfolio (or an average stock), is approximately 35%. However, a portfolio consisting of all stocks, which is called the market portfolio, would have a standard deviation, σM, of only about 20%, which is shown as the horizontal dashed line in the figure above.
6. Thus, almost half of the risk inherent in an average individual stock can be eliminated if the stock is held in a reasonably well-diversified portfolio, which is one containing 40 or more stocks in a number of different industries. The part of a stock’s risk that cannot be eliminated is called market risk, while the part that can be eliminated is called diversifiable risk.10 The fact that a large part of the risk of any individual stock can be eliminated is vitally important, because rational investors will eliminate it simply by holding many stocks in their portfolios and thus render it irrelevant.
7. Market risk stems from factors that systematically affect most firms: war, inflation, recessions, and high interest rates. Because most stocks are affected by these factors, market risk cannot be eliminated by diversification. Diversifiable risk is caused by such random events as lawsuits, strikes, successful and unsuccessful marketing programs, winning or losing a major contract, and other events that are unique to a particular firm. Because these events are random, their effects on a portfolio can be eliminated by diversification—bad events in one firm will be offset by good events in another.
Последнее изменение: вторник, 14 августа 2018, 08:45