Reading: Lesson 4 - Maximizing in the Marketplace
1. Maximizing in the Marketplace
In perhaps the most influential book in economics ever written, An Inquiry into the Nature and Causes of the Wealth of Nations, published in 1776, Adam Smith argued that the pursuit of self-interest in a marketplace would promote the general interest. He said resources would be guided, as if by an “invisible hand,” to their best uses. That invisible hand was the marketplace.
Smith’s idea was radical for its time; he saw that the seemingly haphazard workings of the marketplace could promote the common good. In this section, we will use the tools we have developed thus far to see the power of Smith’s invisible hand. Efforts by individuals to maximize their own net benefit can maximize net benefit for the economy as a whole.
When the net benefits of all economic activities are maximized, economists say the allocation of resources is efficient. This concept of efficiency is broader than the notion of efficient production that we encountered when discussing the production possibilities curve. There, we saw that the economy’s factors of production would be efficient in production if they were allocated according to the principle of comparative advantage. That meant producing as much as possible with the factors of production available. The concept of an efficient allocation of resources incorporates production, as in that discussion, but it includes efficiency in the consumption of goods and services as well.
2. Achieving Efficiency
- Imagine yourself arriving at the store to purchase some food. In your choice, you will weigh your own benefits and costs to maximize your net benefit. The farmers, the distributors, and the grocer have sought to maximize their net benefits as well. How can we expect that all those efforts will maximize net benefits for the economy as a whole? How can we expect the marketplace to achieve an efficient allocation of food, or of anything else?
One condition that must be met if the market’s allocation is to be efficient is that the marketplace must be competitive or function as if it were. We will have a great deal more to say about competitive markets versus less competitive ones in subsequent chapters. For now, we can simply note that a competitive market is one with many buyers and sellers in each market and in which entry and exit are fairly easy. No one controls the price; the forces of demand and supply determine price.
The second condition that must hold if the market is to achieve an efficient allocation concerns property rights. We turn to that topic in the next section.
A smoothly functioning market requires that producers possess property rights to the goods and services they produce and that consumers possess property rights to the goods and services they buy. Property rights are a set of rules that specify the ways in which an owner can use a resource.
Consider the tomato market. Farmers who grow tomatoes have clearly defined rights to their land and to the tomatoes they produce and sell. Distributors who purchase tomatoes from farmers and sell them to grocers have clear rights to the tomatoes until they sell them to grocers. The grocers who purchase the tomatoes retain rights to them until they sell them to consumers. When you buy a tomato, you have the exclusive right to its use.
A system of property rights forms the basis for all market exchange. Before exchange can begin, there must be a clear specification of who owns what. The system of property rights must also show what purchasers are acquiring when they buy rights to particular resources. Because property rights must exist if exchange is to occur, and because exchange is the process through which economic efficiency is achieved, a system of property rights is essential to the efficient allocation of resources.
Imagine what would happen in the market for tomatoes if property rights were not clearly defined. Suppose, for example, that grocers could not legally prevent someone from simply grabbing some tomatoes and leaving without paying for them. If that were the case, grocers would not be likely to offer tomatoes for sale. If it were the case for all grocery items, there would not be grocery stores at all.
Although property rights vary for different resources, two characteristics are required if the marketplace is to achieve an efficient allocation of resources:
- Property rights must be exclusive. An exclusive property right is one that allows its owner to prevent others from using the resource. The owner of a house, for example, has the right to exclude others from the use of the house. If this right did not exist, ownership would have little value; it is not likely that the property could be exchanged in a market. And the inability to sell property would limit the incentive of owners to maintain it.
- Property rights must be transferable. A transferable property right is one that allows the owner of a resource to sell or lease it to someone else. In the absence of transferability, no exchange could occur.
3. Markets and the Efficiency Condition
A competitive market with well-defined and transferable property rights satisfies the efficiency condition. If met, we can assume that the market’s allocation of resources will be efficient.
Consider again your purchase of tomatoes. Suppose the curves of demand and supply for tomatoes are those given in Figure below "Demand and Supply and the Efficiency Condition"; the equilibrium price equals $1.50 per pound. Suppose further that the market satisfies the efficiency condition. With that assumption, we can relate the model of demand and supply to our analysis of marginal benefits and costs.
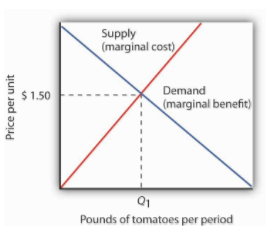
Note: In a competitive market with exclusive and transferable property rights, such as the market for tomatoes, the efficiency condition is met. Buyers and sellers are faced with all of the relevant benefits and costs, and the equilibrium price equals the marginal cost to society of producing that good, here $2.50 per pound. We can interpret the market demand and supply curve as marginal benefit and marginal cost curves, respectively.
The demand curve tells us that the last pound of tomatoes was worth $1.50; we can think of that as the marginal benefit of the last pound of tomatoes since that is how much consumers were willing to pay. We can say that about any price on a market demand curve; a demand curve can be considered as a marginal benefit curve. Similarly, the supply curve can be considered the marginal cost curve. In the case of the tomato market, for example, the price tells us that the marginal cost of producing the last pound of tomatoes is $1.50. This marginal cost is considered in the economic sense—other goods and services worth $1.50 were not produced in order to make an additional pound of tomatoes available.
On what basis can we presume that the price of a pound of tomatoes equals its marginal cost? The answer lies in our marginal decision rule. Profit-maximizing tomato producers will produce more tomatoes as long as their marginal benefit exceeds their marginal cost. What is the marginal benefit to a producer of an extra pound of tomatoes? It is the price that the producer will receive. What is the marginal cost? It is the value that must be given up to produce an extra pound of tomatoes.
Producers maximize profit by expanding their production up to the point at which their marginal cost equals their marginal benefit, which is the market price. The price of $1.50 thus reflects the marginal cost to society of making an additional pound of tomatoes available.
At the equilibrium price and output of tomatoes, then, the marginal benefit of tomatoes to consumers, as reflected by the price they are willing to pay, equals the marginal cost of producing tomatoes. Where marginal benefit equals marginal cost, net benefit is maximized. The equilibrium quantity of tomatoes, as determined by demand and supply, is efficient.
4. Producer and Consumer Surplus
- Think about the last thing you purchased. You bought it because you expected that its benefits would exceed its opportunity cost; you expected that the purchase would make you better off. The seller sold it to you because he or she expected that the money you paid would be worth more than the value of keeping the item. The seller expected to be better off as a result of the sale. Exchanges in the marketplace have a remarkable property: Both buyers and sellers expect to emerge from the transaction better off.
- Panel (a) of Figure below "Consumer and Producer Surplus" shows a market demand curve for a particular good. Suppose the price equals OB and the quantity equals OE. The area under the demand curve over the range of quantities from the origin at O to the quantity at E equals the total benefit of consuming OE units of the good. It is the area OCDE. Consumers pay for this benefit; their total expenditures equal the rectangle OBDE, which is the dark shaded region in the graph. Because the total benefits exceed total expenditures, there is a consumer surplus given by the triangle BCD. Consumer surplus is the amount by which the total benefits to consumers from consuming a good exceed their total expenditures on the good.
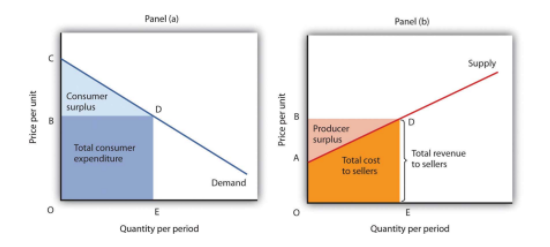
Note: Consumer surplus [Panel (a)] measures the difference between total benefit of consuming a given quantity of output and the total expenditures consumers pay to obtain that quantity. Here, total benefits are given by the shaded area OCDE; total expenditures are given by the rectangle OBDE. The difference, shown by the triangle BCD, is consumer surplus.
Producer surplus [Panel b)] measures the difference between total revenue received by firms at a given quantity of output and the total cost of producing it. Here, total revenue is given by the rectangle OBDE, and total costs are given by the area OADE. The difference, shown by the triangle ABD is producer surplus.
Now consider the sellers’ side of transactions. Panel (b) of Figure above "Consumer and Producer Surplus" shows a market supply curve; recall that it gives us marginal cost. Suppose the market price equals OB and quantity supplied is OE; those are the same values we had in Panel (a). The price times the quantity equals the total revenue received by sellers. It is shown as the shaded rectangle OBDE. The total revenue received by sellers equals total expenditures by consumers.
The total cost to sellers is the area under the marginal cost curve; it is the area OADE. That cost is less than revenue. The difference between the total revenue received by sellers and their total cost is called producer surplus. In Panel (b) it is the light-shaded triangle ABD.
We put the demand and supply curves of Figure "Consumer and Producer Surplus" Panels (a) and (b) together in Figure below "Net Benefit: The Sum of Consumer and Producer Surplus". The intersection of the two curves determines the equilibrium price, OB, and the equilibrium quantity, OE. The shaded regions give us consumer and producer surplus. The sum of these two surpluses is net benefit. This net benefit is maximized where the demand and supply curves intersect.
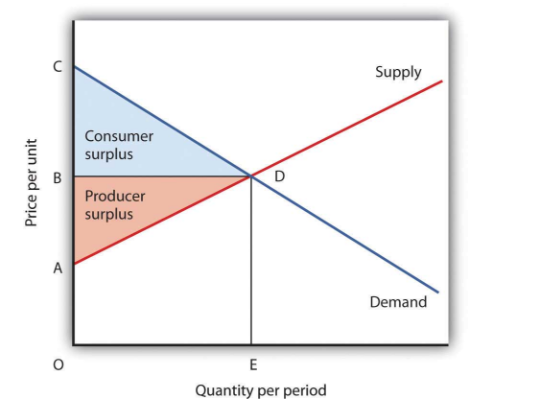
Note: The sum of consumer surplus and producer surplus measures the net benefit to society of any level of economic activity. Net benefit is maximized when production and consumption are carried out at the level where the demand and supply curves intersect. Here, the net benefit to society equals the area ACD. It is the sum of consumer surplus, BCD, and producer surplus, ABD.
We put the demand and supply curves of Figure "Consumer and Producer Surplus" Panels (a) and (b) together in Figure "Net Benefit: The Sum of Consumer and Producer Surplus". The intersection of the two curves determines the equilibrium price, OB, and the equilibrium quantity, OE. The shaded regions give us consumer and producer surplus. The sum of these two surpluses is net benefit. This net benefit is maximized where the demand and supply curves intersect.
5. Efficiency and Equity
Consumer demands are affected by incomes. Demand, after all, reflects ability as well as willingness to pay for goods and services. The market will be more responsive to the preferences of people with high incomes than to those of people with low incomes.
In a market that satisfies the efficiency condition, an efficient allocation of resources will emerge from any particular distribution of income. Different income distributions will result in different, but still efficient, outcomes. For example, if 1% of the population controls virtually all the income, then the market will efficiently allocate virtually all its production to those same people.
What is a fair, or equitable, distribution of income? What is an unfair distribution? Should everyone have the same income? Is the current distribution fair? Should the rich have less and the poor have more? Should the middle class have more? Equity is very much in the mind of the observer. What may seem equitable to one person may seem inequitable to another. There is, however, no test we can apply to determine whether the distribution of income is or is not equitable. That question requires a normative judgment.
Determining whether the allocation of resources is or is not efficient is one problem. Determining whether the distribution of income is fair is another. The governments of all nations act in some way to redistribute income. That fact suggests that people generally have concluded that leaving the distribution of income solely to the market would not be fair and that some redistribution is desirable. This may take the form of higher taxes for people with higher incomes than for those with lower incomes. It may take the form of special programs, such as welfare programs, for low-income people.
Whatever distribution society chooses, an efficient allocation of resources is still preferred to an inefficient one. Because an efficient allocation maximizes net benefits, the gain in net benefits could be distributed in a way that leaves all people better off than they would be at any inefficient allocation. If an efficient allocation of resources seems unfair, it must be because the distribution of income is unfair.
Last modified: Tuesday, August 14, 2018, 10:18 AM