Reading: Law of Demand
Breaking
Down “Law of Demand”
The law of demand is a microeconomic law that states, all other factors being equal, as the price of a good or service increases, consumer demand for the good or service will decrease, and vice versa.
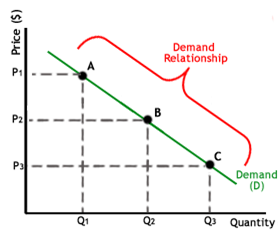
The chart below depicts the law of demand using a demand curve, which is always downward sloping. Each point on the curve (A, B, C) reflects a direct correlation between quantity demanded (Q) and price (P). So, at point A, the quantity demanded will be Q1 and the price will be P1, and so on.
The law of demand is so intuitive that
you may not even be aware of all the examples around you.
-When shirts go on sale, you might buy
three instead of one. The quantity that you demand increases because the price
has fallen.
-When plane tickets become more
expensive, you’re less likely to travel by air and more likely to choose the
less expensive options of driving or staying home. The amount of plane tickets
that you demand decreases to zero because the cost has gone up.
The law of demand summarizes the effect price changes have on consumer behavior. For example, a consumer will purchase more pizzas if the price of pizza falls. The opposite is true if the price of pizza increases. John might demand 10 pizzas if they cost $10 each, but only 7 pizzas if the price rises to $12, and only 4 pizzas if the price rises to $20.
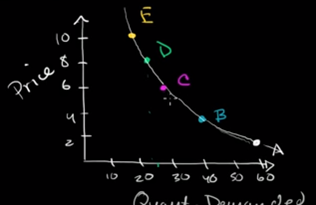
Demand schedule shows the relationship between price and quantity demanded with
all else equal.
Ebook Supply Schedule:
Scenario Price Quantity
Demanded
A 2.00 60,000
B 4.00 40,000
C 6.00 30,000
D 8.00 25,000
E 10.00 23,000
Based off this demand schedule
we can draw a demand
curve
Demand
vs Quantity Demanded
Quantity Demanded is a figure predicated
on the price of a good or service. As prices increase the quantity demanded for
that good or service decreases.
Last modified: Tuesday, August 14, 2018, 10:08 AM