Reading: Lesson 8 - Analyzing and using the financial results— Horizontal and vertical analyses
The calculation of dollar and/or percentage changes from one year to the next in an item on
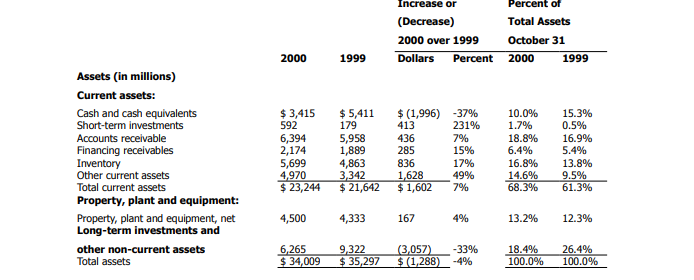
financial statements is horizontal analysis. For instance, in the following data taken from the 2000
annual report of Hewlett-Packard Company, the amount of inventory increased by USD 836 million
from 1999 October 31, to 2000 October 31. This amount represented a 17 per cent increase. To find the amount of the increase or decrease, subtract the 1999 amount from the 2000 amount. To find the
percentage change, divide the increase or decrease by the 1999 amount.
Knowing the dollar amount and percentage of change in an amount is much more meaningful than
merely knowing the amount at one point in time. By analyzing the data, we can see that cash and cash
equivalents declined in 2000. Their decline at least partially explains the increases in some of the other
current assets. We can also see that the company invested in property, plant and equipment. Any terms
in Hewlett-Packard's list of assets that you do not understand are explained in later chapters. At this
point, all we want you to understand is the nature of horizontal and vertical analyses.
Vertical analysis shows the percentage that each item in a financial statement is of some
significant total such as total assets or sales. For instance, in the Hewlett-Packard data we can see that
cash and cash equivalents were 15.3 per cent of total assets as of 1999 October 31, and had declined to
10.0 per cent of total assets by 2000 October 31. Total current assets (cash plus other amounts that will
become cash or be used up within one year) increased from 61.3 per cent of total assets to 68.3 per cent
during 2000. Long-term investments and other non-current assets accounted for 18.4 per cent of total
assets as of 2000 October 31.
Management performs horizontal and vertical analyses along with other forms of analysis to help evaluate the wisdom of its past decisions and to plan for the future. Other data would have to be examined before decisions could be made regarding the assets shown. For instance, if you discovered the liabilities that would have to be paid within a short time by Hewlett-Packard were more than USD 30 billion, you might conclude that the company is short of cash even though current assets increased substantially during 2000. We illustrate horizontal and vertical analyses to a much greater extent later in the text.
Last modified: Tuesday, May 28, 2019, 12:09 PM