Reading: Lesson 4 - Departures from cost basis of inventory measurement
Generally, companies should use historical cost to value inventories and cost of goods sold.
However, some circumstances justify departures from historical cost. One of these circumstances is
when the utility or value of inventory items is less than their cost. A decline in the selling price of the
goods or their replacement cost may indicate such a loss of utility. This section explains how
accountants handle some of these departures from the cost basis of inventory measurement.
Companies should not carry goods in inventory at more than their net realizable value. Net
realizable value is the estimated selling price of an item less the estimated costs that the company
incurs in preparing the item for sale and selling it. Damaged, obsolete, or shopworn goods often have a
net realizable value lower than their historical cost and must be written down to their net realizable
value. However, goods do not have to be damaged, obsolete, or shopworn for this situation to occur.
Technological changes and increased competition have caused significant reductions in selling prices
for such products as computers, TVs, DVD players, and digital cameras.
To illustrate a necessary write-down in the cost of inventory, assume that an automobile dealer has
a demonstrator on hand. The dealer acquired the auto at a cost of USD 18,000. The auto had an
original selling price of USD 19,600. Since the dealer used the auto as a demonstrator and the new
models are coming in, the auto now has an estimated selling price of only USD 18,100. However, the
dealer can get the USD 18,100 only if the demonstrator receives some scheduled maintenance,
including a tune-up and some paint damage repairs. This work and the sales commission cost USD
300. The net realizable value of the demonstrator, then, is USD 17,800 (selling price of USD 18,100
less costs of USD 300). For inventory purposes, the required journal entry is:
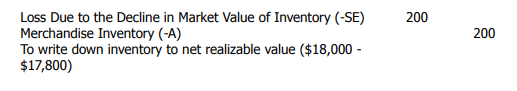
This entry treats the USD 200 inventory decline as a loss in the period in which the decline in utility
occurred. Such an entry is necessary only when the net realizable value is less than cost. If net
realizable value declines but still exceeds cost, the dealer would continue to carry the item at cost.
The lower-of-cost-or-market (LCM) method is an inventory costing method that values
inventory at the lower of its historical cost or its current market (replacement) cost. The term cost
refers to historical cost of inventory as determined under the specific identification, FIFO, LIFO, or
weighted-average inventory method. Market generally refers to a merchandise item's replacement cost
in the quantity usually purchased. The basic assumption of the LCM method is that if the purchase
price of an item has fallen, its selling price also has fallen or will fall. The LCM method has long been
accepted in accounting.
Under LCM, inventory items are written down to market value when the market value is less than
the cost of the items. For example, assume that the market value of the inventory is USD 39,600 and its
cost is USD 40,000. Then, the company would record a USD 400 loss because the inventory has lost
some of its revenue-generating ability. The company must recognize the loss in the period the loss
occurred. On the other hand, if ending inventory has a market value of USD 45,000 and a cost of USD
40,000, the company would not recognize this increase in value. To do so would recognize revenue
before the time of sale.
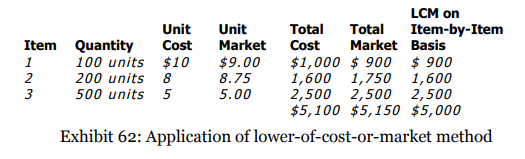
LCM applied A company may apply LCM to each inventory item (such as Monopoly), each
inventory class (such as games), or total inventory. To see how the company would apply the method to
individual items and total inventory, look at Exhibit 62.
If LCM is applied on an item-by-item basis, ending inventory would be USD 5,000. The company
would deduct the USD 5,000 ending inventory from cost of goods available for sale on the income
statement and report this inventory in the current assets section of the balance sheet. Under the class
method, a company applies LCM to the total cost and total market for each class of items compared.
One class might be games; another might be toys. Then, the company values each class at the lower of
its cost or market amount. If LCM is applied on a total inventory basis, ending inventory would be USD
5,100, since total cost of USD 5,100 is lower than total market of USD 5,150.
An annual report of Du Pont contains an actual example of applying LCM. The report states that
"substantially all inventories are valued at cost as determined by the last-in, first-out (LIFO) method;
in the aggregate, such valuations are not in excess of market". The term in the aggregate means that Du
Pont applied LCM to total inventory.
A company using periodic inventory procedure may estimate its inventory for any of the following
reasons:
- To obtain an inventory cost for use in monthly or quarterly financial statements without taking a physical inventory. The effort of taking a physical inventory can be very expensive and disrupts normal business operations; once a year is often enough.
- To compare with physical inventories to determine whether shortages exist.
- To determine the amount recoverable from an insurance company when fire has destroyed
inventory or the inventory has been stolen.
Next, we introduce two recognized methods of estimating the cost of ending inventory when a
company has not taken a physical inventory—the gross margin method and the retail inventory
method.
Gross margin method The steps in calculating ending inventory under the gross margin method
are:
- Estimate gross margin (based on net sales) using the same gross margin rate experienced in prior accounting periods.
- Determine estimated cost of goods sold by deducting estimated gross margin from net sales.
- Determine estimated ending inventory by deducting estimated cost of goods sold from cost of
goods available for sale.
Thus, the gross margin method estimates ending inventory by deducting estimated cost of goods
sold from cost of goods available for sale.
The gross margin method assumes that a fairly stable relationship exists between gross margin and
net sales. In other words, gross margin has been a fairly constant percentage of net sales, and this
relationship has continued into the current period. If this percentage relationship has changed, the
gross margin method does not yield satisfactory results.
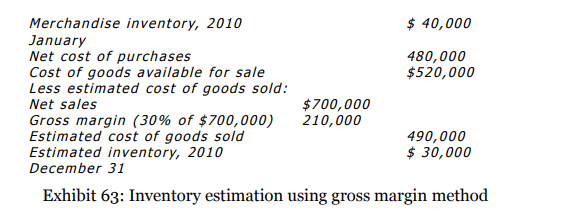
To illustrate the gross margin method of computing inventory, assume that for several years Field
Company has maintained a 30 per cent gross margin on net sales. The following data for 2010 are
available: The January 1 inventory was USD 40,000; net cost of purchases of merchandise was USD
480,000; and net sales of merchandise were USD 700,000. As shown in Exhibit 63, Field can estimate
the inventory for 2010 December 31, by deducting the estimated cost of goods sold from the actual cost
of goods available for sale.
An alternative format for calculating estimated ending inventory uses the standard income
statement format and solves for the one unknown (ending inventory):
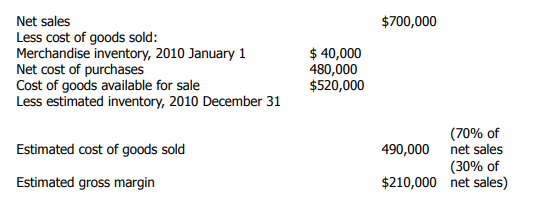
We know that:
Costs of goods available for sale−Ending inventory=Cost of goods sold
Therefore (let X = Ending inventory):
USD 520,000 - X = USD 490,000
X = USD 30,000
The gross margin method is not precise enough to be used for year-end financial statements. At
year-end, a physical inventory must be taken and valued by either the specific identification, FIFO,
LIFO, or weighted-average methods.
Retail inventory method Retail stores frequently use the retail inventory method to estimate
ending inventory at times other than year-end. Taking a physical inventory during an accounting
period (such as monthly or quarterly) is too time consuming and significantly interferes with business
operations. The retail inventory method estimates the cost of the ending inventory by applying a
cost/retail price ratio to ending inventory stated at retail prices. The advantage of this method is that
companies can estimate ending inventory (at cost) without taking a physical inventory. Thus, the use of
this estimate permits the preparation of interim financial statements (monthly or quarterly) without taking a physical inventory. The steps for finding the ending inventory by the retail inventory method
are:
- Total the beginning inventory and the net amount of goods purchased during the period at both cost and retail prices.
- Divide the cost of goods available for sale by the retail price of the goods available for sale to find the cost/retail price ratio.
- Deduct the retail sales from the retail price of the goods available for sale to determine ending inventory at retail.
- Multiply the cost/retail price ratio or percentage by the ending inventory at retail prices to
reduce it to the ending inventory at cost.
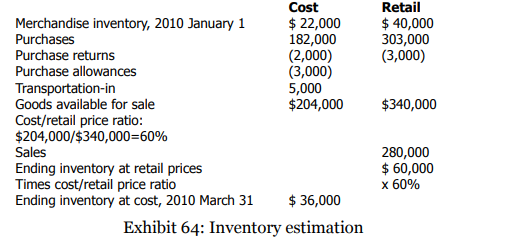
In Exhibit 64, we show the retail inventory method. In the exhibit, the cost (USD 22,000) and retail
(USD 40,000) amounts for beginning inventory are available from the preceding period's computation.
The amounts for the first quarter purchases, purchase returns, purchase allowances, and
transportation-in came from the accounting records. The amounts for purchase allowances and
transportation-in appear only in the cost column. The first quarter sales amount (USD 280,000) is
from the Sales account and stated at retail (sales) prices. The difference between what was available for
sale at retail prices and what was sold at retail prices (which is sales) equals what should be on hand
(March 31 inventory of USD 60,000) expressed in retail prices. The retail price of the March 31
inventory needs to be converted into cost for use in the financial statements. We do this by multiplying
it times the cost/retail price ratio. In the example, the cost/retail price ratio is 60 per cent, which
means that on the average, 60 cents of each sales dollar is cost of goods sold. To find the 2010 March
31, inventory at cost (USD 36,000), we multiplied the ending inventory at retail (USD 60,000) by 60
per cent.
Once the March 31 inventory has been estimated at cost (USD 36,000), we deduct the cost of the
inventory from cost of goods available for sale (USD 204,000) to determine cost of goods sold (USD
168,000). We can also find the cost of goods sold by multiplying the cost/retail price ratio of 60 per
cent by sales of USD 280,000.
For the next quarterly period, the USD 36,000 and USD 60,000 amounts would appear on the
schedule as beginning inventory at cost and retail, respectively. We would include other quarterly data
regarding purchases, purchase returns, purchase allowances, and transportation-in to determine goods
available for sale at cost and at retail. From these amounts, we could compute a new cost/retail price
ratio for the second quarter.
At the end of each year, merchandisers usually take a physical inventory at retail prices. Since the
retail prices are on the individual items (while the cost is not), taking an inventory at retail prices is
more convenient than taking an inventory at cost. Accountants can then compare the results of the
physical inventory to the calculation of inventory at retail under the retail inventory method for the
fourth quarter to determine whether a shortage exists.
Both the gross margin and the retail inventory methods can help you detect inventory shortages. To illustrate how you can determine inventory shortages using the retail method, assume that a physical inventory taken at year end, showed only USD 62,000 of retail-priced goods in the store. Assume that use of the retail method for the fourth quarter showed that USD 66,000 of goods should be on hand, thus indicating a USD 4,000 inventory shortage at retail. After converting the USD 4,000 to USD 2,400 of cost (USD 4,000 X 0.60) you would report this as a "Loss from inventory shortage" in the income statement. Knowledge of such shortages may lead management to reduce or prevent them, by increasing security or improving the training of employees.
Last modified: Tuesday, May 28, 2019, 12:12 PM