Reading: People, Processes, and Managing Data
PEOPLE, PROCESSES AND MANAGING DATA SECOND EDITION
Gerald W. McLaughlin Richard D. Howard
with
Lore Balkan Cunningham Elizabeth W. Blythe Ernest Payne
THE ASSOCIATION FOR INSTITUTIONAL RESEARCH
Number Fifteen Resources in institutional Research
INTRODUCTION
Knowledge Management is the current "in-thing." During the past 20 or so years, Data Management evolved into Information Management (remember IMS and MIS?) and Information Management evolved into Knowledge Management. As you will see, we fully support the concept that knowledge should be managed and include discussions about processes that facilitate the use of information to influence decision making. We object however to the claim by some that Knowledge Management is more important than Information Management or Data Management. As you see in our discussions, all three are key elements to quality decision support. The purpose of People, Processes, and Managing Data is to provide a conceptual and practical framework for creating a quality foundation of data that is necessary for the creation of quality information, quality knowledge, and their management in our colleges.
About 20 years ago, several of us working in institutional research positions were active in both AIR and CAUSE (now EDUCAUSE). In our conversations, we realized that while we did not get into our jobs to manage institutional data, without structured processes for managing data, we could not do our jobs of providing quality decision support information to the leaders on our campuses. Without sufficient quality data our efforts in providing quality decision support and planning information would be, at best, minimal and at worst misleading and destructive. As we developed workshops and papers on topics related to managing data it became clear that technologies (hardware and software) were important tools, but not solutions to the challenges of creating quality institutional data. This reality continues to surface as we talk with colleagues about barriers that limited their ability to have data of sufficient quality to do our jobs. As a result, over the years we talked about and worked on products such as data dictionaries and administrative data bases and worked with tools like data warehouses and desk-top computers. And, the outcomes of these discussions and work were the basis of the first edition of People, Processes, and Managing Data.
As we look back over the past six years, a great deal has changed.
Desktop computing, interfacing with client-servers are now the norm. ERP (Enterprise Resource Planning) systems are being integrated with specialized systems. With integrated and relational data structures these enterprise systems provide the opportunity to build CRP's (Customer Resource Planning) and such. ETL (Extract, Transform, and Load) tools and CASE-type tools give drag-and-drop capability for managing and analyzing data. Data Marts, Data Cutting Tools, and web sites such as IPEDS PAS (Peer Analysis System) and CUPA-HR DOD (Data on Demand) are changing the way we do business. Similarly, analytical tools are available such as OLAP (On-Line Analytical Processing), Data Mining, and statistical software systems. These increased capacities to use data and enhanced ability to distribute data and information to a
iii
much broader range of users both on and off campus have resulted in greater expectations for quality data. Our understandings of - and the conclusions we draw about - our institutions based on our analytical research still depends on the quality of data in our management and reporting systems. One thing however has not changed: software systems designed to support operational systems provide little support in the development of management and reporting systems.
The problems of poor data have not been directly addressed in the evolution of data management software and hardware. Because challenges to data quality continue to exist on virtually all campuses, we continue to offer a module that addresses data management at the AIR Foundations Institute. And, while much of what was published in our earlier volume is relevant to the successful development and management of management and reporting systems, technology has changed and our understanding of data management has become more refined. As such, it seemed appropriate to update People, Processes, and Managing Data, incorporating our latest thinking and practices about managing data and describing the use of some of the information technology that has become available during the past six years.
Over the past six - seven years, the four of us have continued to be involved in data management activities. Betsy and Lore have worked on the creation and operation of a data warehouse and while much of the work they did is reflected in the first edition, they are pursuing other information technology activities at present. Rich has become a Professor and now teaches both colleagues and graduate students about the complexities of institutional research, the processes of decision support, and the use of data in the creation of information to support institutional planning and management. Gerry has returned to some of the basics of managing data, chairing a Management Information Group, co-chairing an effort on standardizing student data, and helping to establish a data element dictionary both for attribute and entity data.
Because of the value of understanding the steps one might take to produce a managed data structure, we are grateful to Ernie Payne from the University of Arizona for his description of the UA data warehouses and for sharing the strategies and lessens learned during the development of their operational and administrative data warehouses over the past 15 years.
Much has changed - much has not changed. However, the basis for successful institutional research remains dependent on People, Processes, and Managing Data.
Gerry Mclaughlin Rich Howard
iv
FOREWORD
All data is meta to something.-David McGoveran (from a tag line on the Internet)
Welcome to our discussion on managing data. Why are we discussing data management? The answer is simple: We all make decisions and often wish we had better data and information to make more intelligent decisions. We firmly believe that at the core of a "quality" institutional research function is the ability to add value to facts in, on, and about the institution. We also believe that if we, as a profession, can develop a structured management process, which adds value to the data in our institutions, then we have identified a core methodology for institutional research.
As new technologies have become increasingly core to the management of our institutions, it has become painfully clear that technology or more complex software does not solve the problem of poor data. The value of data in support of decision making will only improve when the data are strategically managed. There are key systematic, sequential activities which must be performed to produce usable data; and, the foundation of institutional research starts with usable (or quality) data. It is these systematic, sequential, and significant activities which are identified and described in this monograph.
Using Peter Senge's (1990) notions of organizational learning as a backbone, the discussion in Chapter 1 describes the decision-making environment and data use typically found at our colleges and universities. In Chapter 2, a sequential five-function model is described which takes basic data and transforms them into information designed to increase intelligence in the decision-making process. These functions require various activities, tasks, and events, which are described in Chapters 4, 5, and 6. In each of these chapters, a specific role in the data management process is described. In Chapter 4, we describe the Custodian who supplies the data. In Chapter 5, we describe the Broker who restructures the data into information. In Chapter 6, we describe the Manager who supports increased knowledge and accountability across the institution by using data-based information in decision making.
Structured institutional data management and data-based decision making will, at most institutions, require a change in the way decision making occurs. In Chapter 7, we discuss some of the integral issues and barriers to change which you may experience and we seek to explain how you might deal with some of the individuals on your campus who may not be ready to embrace data-based decision making.
Throughout the monograph, frequent problems with data management are identified and some probable causes and possible cures are discussed. The detailed steps in the management of data and the corresponding checklists are designed to make institutional data and information a strategic institutional asset. Our conceptual model, the Information Support Circle, guided the development of the data management processes outlined in this monograph.
V
The Information Support Circle was adapted from the scientific method we learned in high school chemistry. Ideas are identified, unknowns are established, beliefs identify testable hypotheses, data are collected and analyzed, interpretations are developed, and conclusions are presented and focused on a new set of relevant unknowns. This monograph follows a parallel process designed to add value to institutional data and information.
While the monograph is based on this conceptual model, the work has been developed from a very pragmatic and applied perspective. We have a combination of more than half a century of experience (unevenly distributed) in institutional research. The issues described became important to us from a basic desire for survival in our institutions. Our organizational responsibilities have required that we apply various methodologies to support the management and planning of higher education. These initiatives were neither relevant nor rewarded if the data were unusable in the decision making or planning processes we were charged to support.
We started thinking seriously about the concepts of data quality some 12 years ago, writing articles, presenting papers, and conducting workshops on the topic. In writing this monograph, we have used much of the material developed in preparation for these activities, modified as we have learned. The following ideas represent a much clearer vision of how we think the management of data works than when we started thinking through these issues more than a decade ago.
The flow of ideas in this monograph is designed to create a logical focus on strategies, which involve the entire organization in data quality improvement processes. To this end, we guide the reader through a sequence of:
1. thinking about the management and use of data;
2. considering the problems which may exist in providing needed information support;
3. describing the steps to create stable, consistent, and documented data;
4. describing the steps in brokering the standardized data into an institutional asset;
5. describing the steps in moving the data into production and use; and,
6. considering the processes needed to support the continual improvement of data quality and information available to decision makers.
The ideas presented in this monograph are our beliefs, refined by applying the Information Support Circle to support systematic problem solving and decision making. We do not represent our ideas as the only
way to manage and improve data, but as food for thought, hoping that we can all continue to learn. Bon Appetit!
About the Authors
Gerald W. Mclaughlin currently is Director of the Office of Institutional Planning and Research DePaul University where he has worked since 1999. Formerly he was Director of Institutional Research and Planning analysis at Virginia Tech. He is active in the Association for Institutional Research (AIR) and has presented papers and workshops on managing data and decision support in IR to include presentations at the Foundations for the Practice of Institutional Research Institute. He has served as AIR President, Forum Chair and as President and Chair of the annual meeting for the Southern AIR. He has also chaired the AIR Publications Committee, edits IR Applications and the AIR Professional File, and worked with the CAUSE/EFFECT editorial committee for EDUCAUSE (formerly CAUSE). His current interests include analytical methodology and decision support.
Richard D. Howard is currently a Professor of Higher Education at Montana State University-Bozeman. Before taking this position he served as Director of Institutional Research at West Virginia University, North Carolina State University and the University of Arizona. He is active in AIR, currently serving as Editor of the Resources in Institutional Research book series, has presented more than 50 papers and workshops on managing data and decision support in IR, and serves on the Foundations for the Practice of Institutional Research Institute faculty. He has served as President and as Forum Chair for AIR and as President of SAIR. He has also chaired the Professional Development Services Committee for AIR and SCUP, and served on the CAUSE/EFFECT editorial committee for EDUCAUSE (formerly CAUSE). His current interests include the creation and communication of data and information to support planning and decision making, and the development of graduate programs to train institutional research professionals.
Lore Balkan Cunningham has worked in the area of data management for 25 years. She recently retired from her position as Data Administrator and Assistant Director of Information Warehousing and Access at Virginia Tech. Prior to this position, Lore worked on several special data quality projects in the Office of Institutional Research at Virginia Tech. Lore has been a frequent presenter at the EDUCAUSE and CUMREC conferences and co-chaired the EDUCAUSE Decision Support Constituency group. She co-authored several articles in the CAUSE/EFFECT magazine and served for three years on the CAUSE/ EFFECT editorial committee. Lore previously served on the national board of the Association for Information Technology Professionals (formerly DPMA).
Elizabeth W. Blythe is currently Project Director of the Information
vii
Warehouse and Access project at Virginia Tech. She has worked in Information Systems for more than 30 years as a developer, a systems engineer, and a manager. Prior to her current position, she worked in the Office of Institutional Research at Virginia Tech for a year. She has conducted several workshops at SAIR. Her current area of interest is in providing easy user access to data through the Web - managing data, and transforming it into information.
Ernest Payne retired in 2004 after 38 years at the University of Arizona working in large data center operations, software, planing, financial management, administrative systems, databases, and data warehousing. The last 12 years he was the principal architect and project lead for the University of Arizona's Integrated Information Warehouse providing web based and direct access to current and historical data on all facets of the institution to senior administrators, deans, and the people they turn to for information.
viii
CHAPTER 1 INFORMATION AND THE ORGANIZATION
The second requirement of knowledge-based innovation is a clear focus on the strategic position. It cannot be introduced tentatively. The fact that the introduction of the innovation creates excitement, and attracts a host of others, means that the innovator has to be right the first time. He is unlikely to get a second chance. (Drucker, p. 117)
In all sectors of our society and economy, information is used to reduce the level of uncertainty in decision making. It is both an intuitive and methodical process by which more knowledge about the environment is accumulated. Our educational institutions are no exception. Higher education is facing serious management challenges as institutions cope with rapidly changing technology, a fluctuating economy, and increasing demands to produce more with less. These challenges change the way decisions are made, what data are useful, and what data are necessary. All organizations are challenged to create an environment where relevant and usable information can be accessed when needed by both employees and management. This has recently worked its way to a fascination with the Balanced Score Card, Performance Indicators, and a multitude of web based products, often under the rubric of "knowledge management" (Tiwana, 2002).
Making Data Usable
The effectiveness of institutional research in supporting an institution's decision making depends heavily on the availability of usable data. Usable implies that the data are sufficiently accurate, timely, and collected systematically. The institutional research function is often called upon to provide data or create usable information to depict history, describe the current status, and anticipate the future. There are natural barriers which limit the value of data and information.
Data problems are mentioned most often as the major barrier limiting the effectiveness of institutional research and, as such, planning and decision making. Unfortunately, there is often a lack of understanding about the way that the data should be used, skepticism about the validity of the data, distrust because of obvious data defects or errors, lack of access to the data, and often only lukewarm sustained management support for remedying these problems.
The most common factors which limit data quality and which have been identified through the years at professional gatherings of institutional research professionals include:
Consistency of data definitions. Limiting factors here include no agreement on definitions; incorrect interpretations; data collected in varying forms across campus and across institutions; and, lack of adequate comprehensive measures.
Technology. Obstacles here are unsophisticated computer programs; lack of tools to maintain, transfer and analyze data; poor data collection processes; lack of data management tools; and, lack of ability to support distributed decision making. New computer-based operating and management systems have multiplied in the past decade and in many instances these obstacles have become more evident on our campuses.
Data Access. Problems in data access include the inability to access data, and limited user knowledge about what data exist and where to obtain the data.
The improvement of data is critical to the success of the institutional research function's ability to add value to our institutions planning and decision making, and is closely associated with many of our traditional functions. Years of experience tell us that there is no single best way to deal with the need to improve data quality. There are, however, some strategies which are more likely to be successful. In total, these strategies amount to creating a data management culture across the organization.
While the data do not need to be perfect, they do need to be good enough to meet the needs of the institution. To achieve appropriate data quality, an organization first needs to understand itself. The discussion of managing data needs to start with an understanding of common problems that plague our organizations. All organizations are unique, but they do have some common characteristics. The stage for using data must be set in terms of the organization's ability to learn. As noted earlier, the use of data is a learning process. The ability to manage the information infrastructure is a learned process, and institutional research is a process of assimilating information to support institutional learning. And, as stated earlier, increased knowledge and understanding reduces uncertainty in decision making.
Disabilities in Learning to Improve
Peter Senge, in his book The Fifth Discipline, provides two views of organizations. One view examines the learning disabilities, which can exist in an organization. The second view presents the organization as a learning organization, which uses the knowledge it acquires to continually improve. Senge's organizational learning disabilities (discussed below) are extremely appropriate when applied to the challenges we face when trying to use data to support decision making.
I am my position. People in the institution focus only on their tasks and have little concern for how this affects other people. Data flows across numerous desks and functional lines in the organization. The registrar who only works to clean data for registrar functions will never be a source of usable student data for other needs. The vice president who only wants clean summaries will never be the source of high quality detail data. The department head, who needs restructured data based at the program level, has little reason to input better data into a faculty timetable system.
2
The enemy is out there. Each of us has a tendency to blame people outside our immediate unit or department for organizational problems. Because data must flow across organizational lines, blaming others for data problems is natural. If systems are put in place that allow and expect blame, then data will always be a strong candidate for fault. Since perfect data only exist as a fantasy, the means, motive, and opportunity exist for blaming others for faults in the data, and for abdicating responsibility. The concern is about threats, not weaknesses.
The illusion of taking charge. Many of our reward systems require the leader get in front and do something. This is particularly expected when an obvious problem exists. Every so often, there will be a glaring problem with the data resulting in situations such as people who are deceased being invited to the president's reception, some receiving several invitations, or alumni, who have graduated, being contacted and asked why they are no longer enrolled. "Take-charge" leadership to quickly resolve such problems can be disastrous when the take-charge person does not understand complex technical processes. While symptoms are addressed, the underlying problems remain, with opportunities for real improvement displaced by hostilities directed at shortsighted, reactionary solutions.
The fixation on events. As a continuation of the take-charge process, the leader is prone to focus on events rather than results. Data management is a process that tends to focus on improving ineffective structures and events. As such, it is very difficult to maintain the support of a sponsor or senior manager while continuously focusing on errors.
The presence of good information is difficult to demonstrate as an event because it is simply assumed or expected. Furthermore, data improvement does not lend itself to being an exciting key performance indicator.
The parable of the boiled frog. If you throw a frog into boiling water, it will jump out. This, of course, makes some assumptions about the frog, the water, and the pot. If, however, the frog is placed in warm water, as the water is slowly brought to boiling, the frog will not hop out (at least this is what the book says}. The availability of detailed data has gradually attracted the increased interest and awareness of senior executives to the point where data access is sometimes an ego trip rather than the means for better decisions. Substituting "detail" for "intelligence" often occurs gradually until the data manager is confronted with the "awash in a sea of data" accusation by individuals who suddenly realize they do not "know" any more than they did in the years before the arrival of executive information systems (EIS}.
The delusion of learning from experiences. "We learn best from experience but we never directly experience the consequences of many of our most important decisions" (Senge, p. 23). Some critical decisions
3
are the hardware and software purchases made by the institution. The choice of a particular technology impacts many people other than those making the decisions, often several years after the decisions are made. While we learn from these experiences, sometimes painfully, we usually fail to apply this knowledge to the decision process. The decision process is often isolated from the experience.
The myth of the management team. Teams in organizations often tend to spend all their time fighting for turf, avoiding the hard decisions and avoiding things that make them look bad, all the while pretending to work as a cohesive team. This is strikingly similar to what has been referred to as the collegial process. For example, how many true team efforts exist between senior faculty and administrators? Yet data management requires the team effort of administrators and faculty. How many true team efforts occur between academics, facilities management, and financial administrators in a college or university? Yet these groups must combine management activities to capture, store, restructure, and deliver valid and reliable data. As we create credible data, the way decisions are made and the outcome of the decisions will change. This will ultimately shift the balance of power. Improved data is, therefore, a threat to some of the more powerful individuals at our institutions. This learning disability is the most regrettable, as it is the cumulative mechanism which allows and perhaps fosters the existence of the other disabilities.
A learning organization will not evolve naturally, but requires significant effort at all levels of the organization. The institutional research function is positioned to be an effective force in this evolution. Enhancing the value of data to create knowledge is traditionally an expectation of institutional research offices, growing out of a history of institutional research as a user, a producer, and sometimes the source of data for key institutional decisions. The institutional research function at most institutions has the relevant experience and expertise to meet the
challenge of providing or facilitating effective data management to support the learning organization.
The Learning Disciplines
With the backdrop of the organizational learning disabilities as related to data management, consider Senge's alternative for creating a learning organization that would provide the foundation for meeting the data management challenges. The following are antidotes and vaccines for the learning disabilities. They provide a way to either eliminate the learning disabilities, or reduce their impact on the organization. The examples provided with each discipline demonstrate sound data management as an integral part of the foundation for organizational change.
Personal Mastery. Personal mastery is founded on personal competence and skills, and extends to an awareness of the opportunities
4
to evolve one's life as a creative work. Mastery requires applying an understanding of current reality to the shaping of one's future. The strategy used in writing this monograph was to focus on the mastery of skills in areas most appropriate to individuals working with institutional data. We hope this will help to identify and guide in the development of skills necessary to provide data and information as one component of a credible and stable decision-making infrastructure.
Those who would help or lead others are advised by Senge: "The core leadership strategy is simple: be a model. Commit yourself to your own personal mastery. Talking about personal mastery may open people's minds somewhat, but actions always speak louder than words. There's nothing more powerful you can do to encourage others in their quest for personal mastery than to be serious in your own quest'' (Senge, p. 173).
Mental Models. ."..the discipline of managing mental models surfacing, testing, and improving our internal pictures of how the world works-promises to be a major breakthrough for building learning organizations" (Senge, p. 174). This monograph supports the development and use of mental models by presenting the process of managing data as a conceptual model having five functions, three roles, and two properties. We develop the five functions in Chapter 3 and the three roles in Chapters 4, 5, and 6. Finally, in Chapter 7, we discuss the two properties of the model.
We believe that the development of a mental model is itself one of the integral parts of successful data management. The refinement of this model comes after the use of data to influence a situation, frequently by a decision being made. It is when a decision is made that we see the value of structuring data to create information which is finally transformed into organizational intelligence and knowledge. However, because our model is circular, the process is iterative. It is always necessary to review the process of creating the information and the usefulness of the information to the decision maker. Our model supports the learning organization precisely because it represents a process of continuous reduction of uncertainty and improvement.
Shared Vision. Shared vision occurs when multiple individuals have a deep commitment to a commonly held purpose. Individuals are bound together by shared aspirations. The best shared visions reflect, and extend, the visions of individuals. As described in Chapter 2, our vision for data management is simple: Quality in our organizations must be supported by quality in our data. This vision, as represented by our circular model, is quality through knowledge and knowledge from learning. The best management is a process by which adjustments and key decisions are supported in an intelligence-rich environment in which the focus is on continued learning. For a vision to be accepted, it must become a shared vision. Such a shared vision is only possible if it is understood to be constantly evolving.
Team Learning. Team learning occurs when there is an alignment of the individual team members in the process of working together toward the next higher level of awareness. There are three critical dimensions. First, there is a need to think insightfully about complex issues. Second, learning is supported by innovative coordinated actions. Third, there is a need to identify and use multiple tools for data access and retrieval. The roles described in Chapters 4, 5, and 6 are intended to support the development of teams, which function across these three dimensions.
We suggest processes and activities by which teams can work to fulfill the necessary roles. Additionally, in Chapter 5, we identify and discuss various groups that can be formed to learn collaboratively and work cooperatively toward data management goals. In Chapter 7, a discussion of lessons learned and issues related to the change process, provides a background of shared experiences so that others can more quickly develop innovative coordinated actions.
Systems Thinking. The fundamental "information problem faced by managers is not too little information, but too much information. What we most need are ways to know what is important and what is not important, what variables to focus on and which to pay less attention to... and we need ways to do this which can help groups or teams develop shared understanding" (Senge, p. 129). Systems thinking involves seeing fewer parts and looking at the whole. By building on a circular model with the interlocking roles, we present a very complex process as a system.
By identifying problems and symptoms, we provide a structured way of thinking about this system and thereby simplify it. There can be no quality in the management of data unless all the parts work together and recognize their interdependence. This interdependence implies willingness to adapt and to change, as does the Information Support Circle, continually improving and evolving data to intelligence. In the final chapter, we discuss change as a systematic process.
Institutional Research and a Strategy for Change
The institutional research function can be an effective change agent in a cultural evolution, leading institutions toward becoming true learning organizations. This monograph provides a basic strategy from which institutional researchers can influence the major stakeholders in this evolution through a process of continually improving data quality, thus extending and expanding the use of management information across our institutions of higher learning.
The management of data and the ability of an organization to learn are intrinsically linked. The improvement of decision making comes from the increase of organizational intelligence. The symbiotic relationship between reduced uncertainty and organizational intelligence evidences the need for a close linkage between the learning organization and the improved management of data. The management of data, as we think of it, fits the paradigm for discussing the learning organization.
Unfortunately, the learning disabilities discussed above also fit.
6
Institutional research has an interest in the proper performance of key activities in functions which are responsible for creating planning and decision support information. It has an interest in the effective performance of the roles in a learning culture. Above all, it has an ongoing responsibility to affect change and learning by adding value to institutional data and information in our colleges and universities.
In the next chapter, we focus on describing the basis for our own learning that led to the creation of a conceptual model for achieving effective data management and information support. Chapter 2 begins with a basic view of the organization and the organizational roles that relate to information.
CHAPTER2
SOMETHING NEW: MANAGEMENT INFORMATION
The critical issue is not one of tools and systems but involvement in the quality efforts of the business units. (Radding, p. 100)
The impact of technology on our organizations is changing the way we do business. Just as the automobile changed from a luxury to a necessity, information technology is now integrated into the way we manage our institutions. An IBM advertising campaign once called for "new ideas for new challenges." This concept has three key elements relevant to people who work with information. First, there is a strong theme of change. New is the norm and change is the standard. A second theme is survival in the face of challenges. The way we do everything is subject to question because our world is changing at an ever-increasing rate. This theme acknowledges the ever-present threat that, if we fail to adjust, we will become obsolete. A third theme is less apparent, but provides the key to open new doors as we close the old. This third theme revolves around the word "ideas" to reinforce the notion that thinking and creativity are the sources of influence and change.
There is the belief that change will come from creating vision and from new ideas generated at all levels of our organizations. We ask the people at the pulse of every activity to interact and generate innovative ideas. The necessity of acquiring new skills and knowledge is accepted. The ability to learn new skills is critical. Ideas are molded into plans.
Resources are reallocated to support training on the new and improved practices and products. Learning from others comes by generalizing from their experiences and avoids the unwarranted expense of everyone learning everything anew in an organizational culture of "fail and trail" and "discover and recover."
A key organizational challenge is to make better decisions and provide better support for stakeholders. Information support must enable managers and decision makers to:
1. understand a situation and recognize the need to take action;
2. identify and rank alternatives considering resources, causality, and desirability of outcomes;
3. select an alternative, act upon it; and,
4. validate and defend the action.
The successful use of information for decision support depends on an information support structure that assures the quality and availability of relevant data that can be restructured for use by the decision makers. The old ways of providing information support do not adequately support new ways of doing business. The disappearance of middle management, the development of intelligent devices, and the refinement of strategic management, are all components of the new challenge. To meet this challenge, we need new ideas about providing information support for our organizations.
8
Organizational Changes
There have been rapid changes in the technology that we employ to manage data. Complementary changes are now occurring in our organizations and in our concepts about information systems. We are experiencing a simultaneous push by technology and pull by management to deliver useful information. We have traditionally only focused on maintaining data in operational or legacy systems which were organized by staff function: finance, student, personnel, etc. It is naive to assume that all required management information resides in these historical legacy systems, and that the challenge is simply to implement new technology that will deliver data on demand to an ever expanding clientele. Management's requirements are driven by new needs to perform analyses related to both long-term and short-term decisions.
The operational systems that perform day-to-day transactions were not designed to support management decision making, and probably do not contain sufficiently standardized or normalized data for the integrated, recombined, and longitudinal views required for analysis.
In response to the increasing pressures on legacy systems, existing internal and external reporting functions often use informal procedures to obtain data and interpret the variables. Often, there is not a predominance of historical files, census files, or standardized data maintained by the operating functions. In addition, there is often no formal assignment of responsibility for data management. The result is often a lack of policies to govern the processes by which those who manage operational systems capture, store, define, secure, or provide data and reports to institutional management.
Typically, when management requests for information fan out to different operational areas, each area responds by providing data from the perspective of its functional activity. Typically, this results in: (1) the executive drowning in data with no options to analyze and transform the data to useful information; (2) the executive receiving multiple, biased, and conflicting information; (3) the information being based on incomplete assumptions about the desired analysis and on data that are not integrated; and, (4) failure to properly obtain needed information produces organizational overhead, requiring the expenditure of additional resources.
Nevertheless, there are several organizational trends at many of our colleges and universities which offset the rather gloomy picture painted above and set the stage for creating a data management culture that can effectively respond to management information requirements.
The first trend is toward greater efficiency and competitiveness. With this comes a willingness to consider a variety of strategic alternatives. These strategies include changes in support structures, processes, and responsibilities. They also often produce an analysis of data needs. The second trend is the migration to new operational systems, and increasingly distributed modes of operation. New development tools, as well as off-the-
9
shelf software, include structured methodology for building an enterprise's data architecture, data definitions, and standard code usage. Since these methodologies provide the foundation for any executive information system, the migration presents the opportunity to analyze management's information requirements. The third trend is recognition that there is aneed for more participative management. (Harper, p. 10-11)
The use of participative management extends the number and also the skill-set of managers who need to access and use data from across the organization. It also changes the focus and organization of the data needed.
Decision makers often need an integrated view of multiple operational systems. This includes peripheral systems that are often not prime candidates for migration to integrated operational systems. This leads to the realization that there are ongoing data management activities that must be maintained to assure the availability of high quality information from all operational systems to support proactive decision making.
Authors in trade magazines and journals have labeled these trends as "reengineering," "right-sizing," and "total quality management," "Continuous Quality Improvement," Customer Relations Management," and then "Knowledge Management." Each term points toward improvement of the information support functions and spurs an interest in what can be done to accelerate progress. However, the lack of a structured process for coordinating various data management activities and relationships across the organization limits and jeopardizes potential momentum toward progress. Still, there remains a multitude of potential opportunities within the existing culture to leverage traditional relationships and friendships and to develop prototypes that push management's "hot buttons," thereby creating support for ongoing, quality data management work. Because organizational culture is dynamic, it is often accompanied by pressure to produce quick results that benefit the current culture. Producing relevant prototypes that address current needs increases the likelihood that quality data management projects will be included as part of other evolving organizational changes.
We can start with an understanding of the information support process, which focuses on the decision maker's needs (Table 1). We also need to define the authority and responsibilities of people who deal directly with operations and train them to respond to opportunities and
Table 1 Decision Maker's Needs
|
Needs.... |
Instead of... |
|
Tactics, techniques, and procedures |
Long-range plans |
|
Incremental changes s |
Major decision |
|
Majority of time spent on defining the problems, developing possible solutions, and monitoring results |
Majority of time spent on making a decision |
10
challenges based on the purpose of the organization, various alternative actions, and the authority inherent in the situation. Critical in this process are the acceptance and understanding of a conceptual model which includes operation functions, the process of decision support, and the use of technology which enables information flow. Equally important is the awareness that real progress depends on small incremental steps rather than large leaps.
Basic Concepts of Information Support
When our organizations were more static, information flowed on a consistent and traditional path. Management by evolution was perfected by incremental trial and error. Situational change was not anticipated and tended to evolve slowly, allowing the management culture to adapt slowly and comfortably. Today's dynamic organization needs a managed data resource whereby information flow can be adapted daily to meet current needs. We no longer have the luxury of evolving our information management any more than we have the luxury of evolving our organization. The future needs of the organization must be anticipated. Concurrently with the anticipation of new organizational structures and functions, there need to be new decision-support infrastructures. By understanding the steps in providing information and data, we can provide the required facts where the organization needs them, when the organization needs them. The old ways of changing the information support structure after the organization is changed will result in the data never catching up to a decision maker's needs.
We think the Information Support Circle (Figure 1) is a useful conceptual model for creating a relevant and sufficient awareness of these issues. As a model, it admittedly is a simplification of reality. However, it provides a basis for discussion of the process of creating decision support information.
Figure 1 Information Support Circle
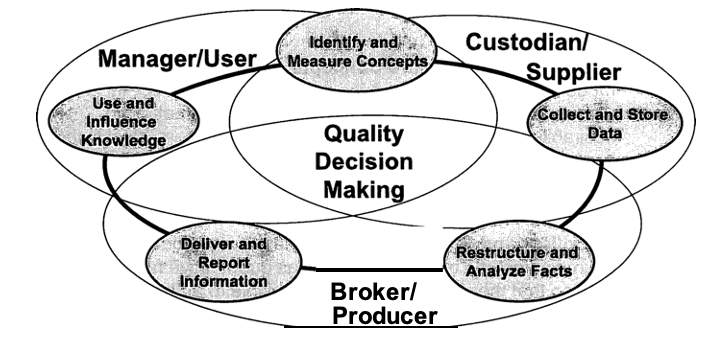
The Information Support Circle has five basic functions, three key roles, and two major properties. The five functions provide a basic framework for the tasks associated with helping people make informed decisions. The roles provide a structure in which specific tasks can be organized and assigned to individuals in the organization. The properties guide us in improving the quality of information provided to the decision process.
The Five Functions
The five functions provide a framework within the Information Support Circle for describing specific steps and activities (Figure 2). Each function has two sequential activities and a standard of quality. A short description of each function follows. Specific activities and quality standards are discussed in detail in Chapter 3.
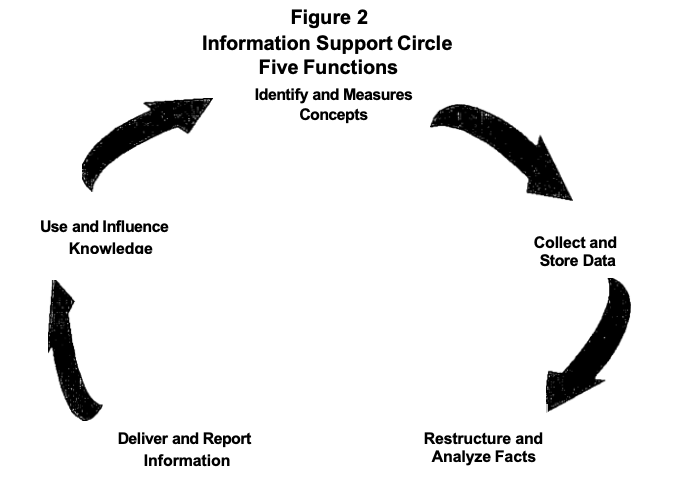
1. Identify and Measure Concepts. Develop a conceptual model of the situation. Describe its major components. Include measurements which explain the feasibility of alternatives, desirability of outcomes, and availability of resources. Identify the key individuals and groups of individuals who have a stake in the process. Define the essential elements required to make the decision.
2. Collect and Store Data. Obtain data from various relevant sources. Include qualitative as well as quantitative facts. Store data so that they are secure and accessible to authorized users. Use technology where appropriate. Standardize the codes used and develop a collection of definitions and documentation. Edit
12
and audit for correctness. Document the procedure, the situation, and the process of data capture and storage.
3. Restructure and Analyze Facts. Bring the data together from the various sources. Integrate using standard merging variables. Link to qualitative facts. Analyze with appropriate statistical and deterministic procedures. Summarize and focus the data on the situation. Compare with peer groups, look at trends, and describe limitations in the methodology.
4. Deliver and Report Information. Apply the information to the situation. This includes using appropriate delivery technology to make the restructured facts available for further restructuring. Interpret instances where there may be differences or gaps between the collection of the data and the current need to make decisions. Identify systemic sources of bias. Focus reporting on the specific alternatives and support interpretations of causality and desirability of outcomes.
5. Use and Influence Knowledge. Use facts to clarify the situation, to make a decision, or to advocate a belief or value. Identify the way the new knowledge expands the previous understanding. Determine the changes in the environment and what is assumed about the situation. Consider the importance of new information relative to the issues incorporated in the previous conceptual model.
Three Key Roles
The roles explain the way the functions, described above, are related to institutional management. These roles may be thought of as clusters of responsibilities, tasks, and activities that can be assigned. The roles bridge the separate tasks of the functions into sets of authorities, responsibilities, and abilities (Figure 3). The following are
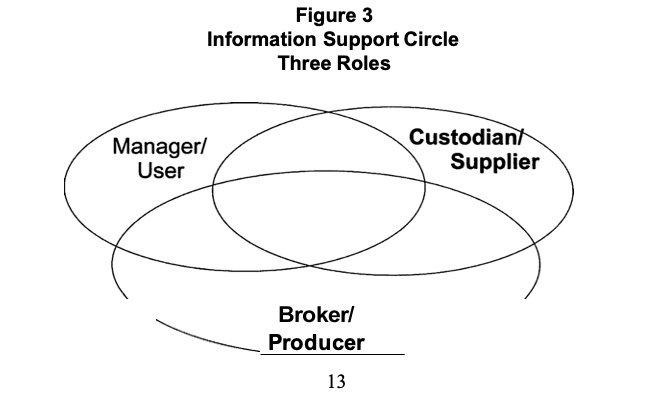
brief descriptions of the three roles in the paradigm. More complete descriptions are provided in Chapters 4, 5, and 6.
1. Custodian. The custodian focuses on the integrity of the data and helps select appropriate data for the analysis. The custodian adds value by contributing operational knowledge. The custodian needs data management and administration skills. The custodian also influences the selection of the methodologies and the development of the essential questions which identify the information need.
2. Broker. The broker works to transform the data into information. This involves integrating data from various sources, restructuring data to focus on the areas of concern, and analyzing the data to look for causality, desirability of outcomes, and parsimony of elements. The broker participates and consults in the selection of the methodologies and the development of the essential questions for decision making.
3. Manager. The manager takes the information and applies it to the situation. In this manner, the information becomes part of the intelligence of the situation and reduces the uncertainty of the situation. The manager is often the decision maker but may also be someone responsible for supporting the decision process.
Some of the decisions are external, such as identifying what product to buy. Other decisions are intermediate and internal, such as evaluating business processes. The manager has a primary responsibility to identify the important elements of the problem, and also the unknowns.
Two Major Properties
Two properties provide a mechanism for evaluating the functions and the roles. These are the core values of the model, governing the essential actions: DO THIS and GET THAT. We have found it useful to separately conceptualize these as two properties although the two are not mutually exclusive. Dependency is the property which deals with the influence each function has on the others. Cooperation is the property which deals with the relationships between the three roles. These properties are briefly described below and further developed in Chapter 7.
1. Dependency. The five functions form a circle (Figure 2). The value, which can be added for each function, is dependent on the quality of the preceding function. How you do each step defines the quality of every following step. No function can produce quality or add value beyond the quality of the preceding function. For example, if the reliability of the data from the capture and storage step is poor, then no sophistication in methodology or increase in the amount of resources for analysis will overcome
14
the low reliability. If the conceptual model is weak and erroneous content is selected for measurement, the resulting information will be seriously compromised regardless of the resources employed at a later step. The quality of the information produced is only as good as the quality of the weakest link in the circle of functions.
2. Cooperation. The quality of the information you get depends on the mutual involvement in key activities. The ability to provide quality management comes from mutual investment and interaction of the three roles (Figure 3). If the individual filling any one of the roles decides to act only in his/her own best interest, the integrity of the information support process is negatively impacted. In a self-contained operational scenario, the data custodian may change the definition of a variable to support a new operational need and inadvertently compromise the intended use in another area. The broker may propose an analysis requiring data that do not exist. The manager may start looking at new problems without notifying either the broker or the custodian.
Cooperative interaction among the three roles permits identification of opportunities to solve specific problems while positioning the data structure to support future needs. It allows the use of analytical procedures (1) that can be focused on identified needs and (2) which are sufficient for the integrity of operational data. This synchronization provides the highest quality information to support the best organizational outcomes given the constraints of time and resources.
Changing Users
As institutions respond to change, one likely outcome is downsizing. During downsizing, individuals typically leave organizations based on their readiness to leave, rather than the needs of the organization. Downsizing and rightsizing typically occur in the middle of the organization, the domain of staff specialists and middle managers. Further, reorganizing and restructuring often result in nontraditional management structures such as matrix reporting, task forces, or cross-functional teams. All of this requires individuals to develop a broader skill set. "Empowered" individuals need to be able to solve problems and recognize when they need to involve others in the problem solving.
The manager of tomorrow needs a broader and more flexible range of skills. This monograph helps meet this need in two key ways. First, a set of categories in which skills may be necessary are identified. Second, it shows related areas and types of activities that require cooperative work.
Each data management role encompasses a set of skills and expertise that can be brought to bear on any situation. The custodian supports the functional area. This requires traditional business skills such as accounting, personnel, and finance. The broker role requires
15
experience with methodologies including management science, statistics, decision science, and computer science. These are the methodologies which facilitate the translation of data from the functional areas into information to be provided to those who apply the information to a specific situation. The manager role requires an understanding of decision science, organizational behavior, and knowledge of specific characteristics of the industry. A decision maker in any of these areas needs to understand and appreciate the contribution of the others.
When institutional change becomes an identified need, reactions are often much the same as Kubler-Ross (1974) outlined in an individual's acceptance of death and dying. The first reaction is denial that the change is required. The second reaction is hostility that results from uncertainty and anxiety as individuals admit the rules are changing. This is when cooperative work between units across the organization is most essential to both organizational and individual well-being. At the same time however, cooperation may also be extremely difficult to achieve because of the individuals' insecurities. In this situation, quality information can be leveraged to bring the fearful together and create a frame of reference for ongoing cooperative work. The resulting bargaining makes functional changes possible, although the following depression must be dealt with before acceptance.
Changing Data Support Structures
The data support for new organizations will depend on the development of effective management data. This requires focusing on the decision process and on the uses of the data. Decision makers need an integrated set of data from both internal and external sources, including both current data and point-in-time historical longitudinal data. Because users operate in a variety of technological environments, the support structure must adapt with new software tools, expanded skill sets and training, and a new appreciation for the final product-management information.
In order to create a viable data support structure, the following will have to be developed and/or implemented at the institution:
Data Requirements
• Standardized and integrated current data: selected data, defined and restructured to reflect the business needs as viewed by decision makers
• Standardized and integrated historical data: selected data, defined and restructured to reflect changes, which are comparable with other institutions and useable in trend analysis
Software Tool Requirements
• Inter-connectivity tools: software to extract, transform, and integrate the separate databases, which support multiple types of networks, and are easy to use
• Relational and analysis tools: software which creates and loads
16
data structures and which supports statistical analysis of the data, tabular and graphical displays, and which answers "what if' business intelligence analyses.
• Security tools that are designed for a networked sub environment: software that limits data access to sets of measures and groups of people, and prevents disruptions of service.
Skills and Training Requirements
• Skills: to analyze and restructure the data with the appropriate tools
• Training and support: in technology and methodology (including statistical sophistication, Web strategies, data cutting tools, and an awareness of the latest developments for data access)
• Knowledge: to map complex analytical procedures and organizational processes
• Ability: to verify data validity and reliability
The Changing Institutional Research Function
Technical tools are necessary, but not sufficient to provide quality information support. The mission of institutional research is to enhance institutional effectiveness by providing information which supports and strengthens operations management, decision making, and unit and institutional planning processes. The institutional research function is most closely aligned to the information broker role and relates to data in three ways:
User. Institutional research is a user of all the critical and key administrative data elements. As such, it has many of the needs of managers.
Producer. Institutional research is a producer, dealing with data quality issues and data integration challenges in order to provide internally and externally standardized extracts of time variant data. This can be thought of as populating a data warehouse.
Supplier. Institutional research has an obligation to both its internal and external customers to supply current levels of information and analysis support while creating more effective delivery strategies to address requirements of various users of institutional data. This also sometimes involves us getting into the data storage business with data marts, Operational Data Stores (ODS), and data warehouses.
It is clear the successful institutional researcher is dependent on positive relationships with data suppliers and on the quality of their data.
17
Simply put, institutional research is the basic process of adding value to the information and data available to a manager. Recent workshops conducted on effective institutional research highlighted four goals for effective institutional research related to data. These included providing accurate and timely data, developing a system of data collection, creating usable data, and providing trend data. Not surprisingly, participants identified data problems as the major barrier to their effectiveness in meeting these goals. Specific data problems include:
Data Definitions. Disagreement on definitions; incorrect interpretations; data collected in different forms; and, lack of adequate comprehensive measures.
Technology. Lack of hardware and software resources to maintain, transfer and analyze data; poor data collection tools; lack of data management tools; and, lack of decision support tools.
Data Access. Inaccessible data at both the local and state level and lack of data about the data (where the data are located, how the user obtains access, etc.).
To increase effectiveness, institutional research must support efforts to improve the data quality. There are several reasons for this. As a comprehensive user and customer, institutional research has extensive data-use methodology skills. Further, professionals in institutional research can teach these skills. These skills include using statistical, comparative, projective, and qualitative methodologies. Also, as an office which often coordinates reporting with external agencies, institutional research is heavily involved in negotiating definitions and supporting the institutional reporting and information requirements.
Standardization can enhance the value of state and national databases. When offering support to various internal offices, institutional research can often assist custodian efforts to improve standardization of data and definition of codes. This is also the opportunity to bring the manager together with the data custodian so both can better understand the need to obtain and properly use data.
A View for Adding Value
We have discussed the new management challenge facing our institutions, a sea change which forces changes in the way decisions are made. This impacts how decision makers are supported and increases management's demand for useful data. The institutional research function is positioned to be an effective force in the improvement of the integrity and value of the data and, therefore, is at the root of our institutions' response to change.
There is no best way to improve the management of data. There are, however, some strategies which are likely to be successful. The ideas and thoughts in this monograph are presented to help focus on some of these strategies. The ideas are organized to work through a
18
sequence of looking at the need for improving data management, to describe some of the steps which we and our colleagues can take to overcome the problems in our data, and, finally, to look at what can be done to make things better.
These discussions challenge all of us to deal with three questions, which lead the way to knowledge:
• What do we know?
• What does it mean?
• So what?
In the next chapter, we discuss the five functions of the Information Support Circle and the problems, or "diseases," often associated with each.
CHAPTER3
STEPS IN QUALITY INFORMATION SUPPORT
Strangely enough, it seems that the more information that is made available to us, the Jess well informed we become. Decisions become harder to make and our world appears more confusing than ever. Psychologists refer to this state of affairs as "information overload," a neat clinical phrase behind which sits the Entropy Law. As more and more information is beamed at us, Jess and Jess of it can be absorbed, retained, and exploited. The rest accumulates as dissipated energy or waste. The buildup of this dissipated energy is really just social pollution, and it takes its toll in the increase in mental disorders of all kinds, just as physical waste eats away at our physical well being. The sharp rise in mental illness in this country has paralleled the information revolution. (Rifkin and Howard, p. 170)
Assessing the Information Infrastructure
To avoid information overload, and the attendant mental disorders suggested by Rifkin and Howard, it is helpful to start with a set of beliefs about the order of reality, mental models in Senge's terms. We do this with the five functions of the Information Support Circle. These become a means of structuring the information support process and the process of managing data. Before discussing these five functions in detail, it is helpful to realize that the institutional context in which they exist is unique to each specific institution.
The information architecture of an institution is the predominant style of designing and maintaining the structure of information and can be described in one of three evolutionary stages: decentralized data management, centralized data management, or distributed data management (Figure 4).
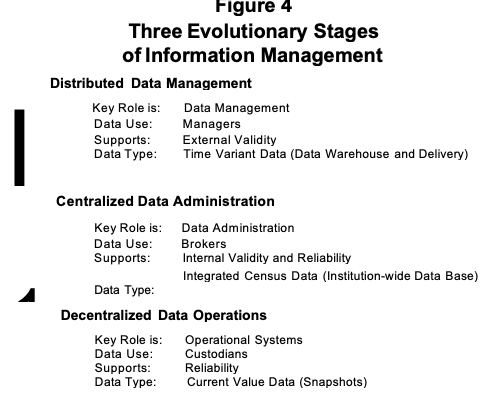
Decentralized data management focuses on data support in the operational systems. These systems and their custodians are the source of institutional data and data definitions. These data primarily are used internally to support
operational processes and decisions. The major issue in a decentralized environment is reliability: are data based on consistent and stable definitions? Are they collected systematically?
Centralized data management focuses on data administration. The primary use of the data is for studies and management information. In addition to meeting operational needs, the data now become an institutional resource, integrated and analyzed for the support of central decision makers. The major concern in this environment is the internal validity of the data. Those who create centralized databases must understand how the data are going to be used so the data can be prepared to meet the decision makers' needs. The source of the data often includes integrated census files taken from the operational systems and placed into a data warehouse.
Distributed data management focuses on the process which controls the flow of the data from source to use. Primary ingredients are the manager and the outcomes of processes or programs. Here, the major concern is the external validity of the data. To what degree can the implications of the data be applied to the current situation? Distributed systems include integrated census data which provides a campus-wide view, including department- or program-level detail.
It is important to recognize and understand an institution's stage in the continuum of information management development. The stage of the data management process should relate to the organization's stance. If the institution is operating in a highly centralized mode, the data management process should be focusing on the internal validity of the data. On the other hand, if the institution wants to provide adequate distributed data to a set of distributed decision makers, then the data management function must support reliable operating systems and an integrated census database before it can deliver data which will be of value to the distributed user. Clearly, the changes discussed in Chapter 2 are rapidly pushing all organizations toward a distributed environment. It must be re-mentioned; however, to operate at that level, the organization must provide adequate data quality at the preceding two levels.
The Role of Data
Creating and using information is the business of institutional research. Information has value when it reduces uncertainty in planning and decision making. The production of information is a cyclical process which includes identifying measures as data elements, capturing and storing appropriate data, analyzing and restructuring the data into information, and distributing and reporting the resulting information. The Information Support Circle (Figure 1) is closed by the user, when feedback is provided by the manager to the broker and the custodian about the usefulness of the information in creating knowledge and well being that add value to the institution.
Data and information have value to the decision maker if uncertainty associated with the decision is reduced. It is almost certain that the more important the situation, the greater the power of the information. In
21
other words, institutional researchers profit by the quality or usefulness of the information we provide the decision maker. More and more, our ideas and organizations will profit or lose by the quality of the information produced and communicated, internally and externally.
The development of quality information is a complicated process.
This process requires that individuals work together with a sense of common purpose, an understanding of the information process, and an awareness of, and ability to use, some basic tools to solve problems.
Below, we describe a process for developing quality information. This is an iterative process requiring cooperative efforts across the campus.
Barriers to Quality Information
As we have seen, five fundamental functions must be adequately performed to generate quality information. In the following discussion, we explain what is supposed to happen in each function. In addition, "diseases" and their symptoms that result in organizational disabilities which inhibit organizational learning are described. These diseases limit the effectiveness of each function in the Information Support Circle and as such the quality of information produced. This "disease" analogy provides a model that researchers can use to evaluate the viability of each function in their decision support efforts. Remember, these are only the principle diseases, there are other related "ailments" too numerous to discuss. Although healthy signs are no guarantee of a healthy situation for a function, their absence definitely indicates a problem. We encourage you to complete the checklist in Appendix A. The weakest link in the Information Support Circle can be diagnosed readily from this checklist. We recommend an examination of the function with the lowest score as this function is the most debilitating. Be aware however that while this particular function may have the most visible set of problems, it may not be the underlying or root cause of poor data and information at your institution.
Function: Identify and Measure Concepts
The first step in the creation of decision support information is to identify and measure the appropriate concepts. The focus must be: What information do we really need to know? and, What are the essential elements of this information? Often this will start with the decisions that need to be made. Specifically, the requirement at this step is to identify facts, both qualitative and quantitative, which are needed by the decision maker to both make and communicate the decision(s). The creation of quality information must be based on a conceptual model. This model includes not only the decision being made, but also the context in which it is made, and an understanding of the constraints and the consequences of the decision. The selection of the concept(s) to measure must consider the key types of performance: effectiveness, efficiency, timeliness, and reliability. The items identified and the metrics developed must be sufficient, reliable, and reasonably easy to create. The context should focus on the ends, rather than the means. Once the process is implemented, selected measurements should not disrupt the process.
22
Disease: "Belief Bulimia." The semi-random gorging and purging of data without identification of the concepts that are to be measured.
This prevents the proper development of a model and.the measurement of appropriate variables. Here, there is no consistent focus by the decision maker, so there is no way to determine a specific area of interest or concern. After the objectives of an activity are established, there also may be a gap in the communication of those objectives to staff and analysts who are working to collect the data and create the information.
Some goals and objectives may not be measurable using available data sources. There is no shared conceptual model of the situation and, therefore, no way to evaluate the usefulness of the data for decision support. The primary symptom of "Belief Bulimia" includes random interaction between managers, brokers, and custodians, which results in "knee-jerk" inclusion of data to address specific purposes until the next crisis and rapid retro-grade studies.
Function: Collect and Store Data
After required facts are defined and operational measures are identified, the corresponding data need to be collected and stored by a unit or units within the organization. Computer-based data will be more accurate when it is collected at a single source where data first come into contact with the organization. External information should be captured in a systematic fashion using documented procedures such as environmental scanning. All coding must be done in a stable and consistent fashion. Storage requires the systematic development and use of a database management system. In addition, there must be documentation about the data which is stored in the system. A data element dictionary and set of descriptions are essential components of proper coding and storage of data. Meta-data should be identified and made available to the users. Time-date data should show "as-of' status of attributes.
Similar measures should yield similar results. The data must be captured with the same set of categories and codes regardless of where they are collected, when they are accessed, or who is responsible for the data collection. Finally, the data must be internally consistent when cross checking codes. For example, an active address should only exist in the record of someone who is living. Census-date data marts and similar frozen data sets are very valuable for producing stable and consistent data.
Disease: "Data Dyslexia." This occurs when there is an inability to recognize data, often confusing one data element for another. Data coding often relies on an individual's memory, or is recorded on post-it notes, or the backs of envelopes, resulting in confusion about what is stored, where it is stored, when it was stored, and why it was stored.
Concerns are often met with a "we-have-always-done-it-this-way" statement. The same variable, for example "student," will have different meanings in different tables in the data structure. The lack of a strong institutional commitment to the information support function results in the
23
lack of policies and procedures. Resources are not allocated to ensure that data collection processes are documented and coding standards are in place. Traditional compartmentalization of units within the institution tends to reinforce activities in one department that may be inconsistent with the capture of data to support other departments. This environment is characterized by a lack of consistent technology and standards for the development of the data dictionary or other documentation. This includes non-compatible machines and multiple capture points for a given data element. All of this gives rise to creative data elements based on unwritten rules. One variable is used for another purpose "until later." For example, one institution coded people handling hazardous materials as buildings so they would show up on an annual list requiring maintenance to show when the people needed annual physicals. A readily recognized symptom is found in the statement: "This is only temporary...we are getting a new system to solve that problem." Also, a symptom that "data dyslexia" on your campus is when business rules used to create derived elements cannot be produced in writing.
Function: Restructure and Analyze Facts
Here, data that were originally structured to support operational transactions are restructured into formats that support reporting and the decision support process. Data should be integrated, summarized, and analyzed so that interpretation and inferences of causality can be made. Data reduction can be accomplished by creating subgroups, combining variables, summarizing detail, and identifying trends.
Data are normally grouped by institutional entities for which the data are attributes. Student transactions are stored in the student database, faculty data are stored in the faculty database, and so on. These data must be restructured and integrated to address organizational issues, and can require combining existing variables and creating new variables.
Business rules come into play to integrate and edit the data. Adequate tools should be involved in transforming the data but tools do not replace the need for human thought. In addition, analyses may be required to synthesize events where the summary of an analysis becomes a new variable. Combining appropriate data can form metrics and indices. For example, based on a series of decision rules an employee may be classified as faculty. This handling and restructuring of data may involve merging qualitative and quantitative data. Properly done, restructuring and converting the data into the users' frame of reference results in the reduction of the complexity of the data without major loss of relevant detail. This is the intent of methodologies such as performance indicators. The method for recoding or recreating a variable is also needed in the meta-data so that an audit can check the validity of the variable.
The analysis phase of information support reduces the amount of data to a level which can reasonably be comprehended by the decision maker while retaining the primary facts portrayed in the data. This step is critical to establish the causality in producing the outcomes being
24
considered. It is also critical in the stream of evidence that leads to the decision of preferences. This phase integrates multiple sets of facts. The process is rational and sequential, taking into account the intended use.
Disease: "Dimensional Dementia." This disease strikes when there is a lack of agreement on the frame of reference for analysis and interpretation. Should the analysis be concerned with one-year results or five-year results? How much data should be summarized? Interpretation is independent of the context in which data were collected.
Summarization occurs over variables which have no logical relationship. Analysts use the most impressive statistics available. Data are segmented into groups without an understanding of the rationale for segmentation. Uninterpretable statistics are the result of irrational data groupings. Those who suffer from "Dimensional Dementia" forget why the analysis is being done and data are grouped incorrectly. No one remembers how the data were recorded or what the resulting metrics mean.
Function: Deliver and Report Information
Delivery is the process of placing the restructured and often analyzed data and "cleansed" information in a location where the manager has access, like a data warehouse or Web site. Reporting is the advanced process of interpreting the information in context. Starting with the executive summary and continuing through the facts and figures, delivery and reporting should focus on the specific need of the users.
The broker needs to provide support so that the manager can generalize the results of the data and information for various desired uses. The reporting should be structured so the manager can check whether the results and data apply to current and future situations. Reporting should allow the manager to determine how to use the results in a valid manner. To what future situations will the results apply? There should be the opportunity to integrate qualitative as well as quantitative data. Reporting should involve some basic consideration of outcome preference and causality.
Delivery and reporting can be heavily influenced by technology. At one end of the scale the broker presents the information to the manager, delivering an overview in person. At the other end of the scale, the manager accesses the information using a networked computer and tools such as online analytical processing (OLAP) cubes, pivot tables, active server pages (ASP), dashboards, decision support systems, and executive information systems. In this case, the computer/network presents the information to the user, but the broker is still involved in the modeling and analyses.
Disease: "Myopic Megalomania." This disease is characterized by the self-centered, shortsighted, delivery of data and information based on the whims of the deliverer or the deliveree. Reports are designed to demonstrate the technical prowess of the provider. The provider has an
25
attitude of technical supremacy. There is an overemphasis on the media rather than the message and a continued disregard of user needs. Too much time is spent working with the tools, trying to make the results "exciting." In contrast, not enough time is devoted to ensuring the quality and relevance of the content. For example, "Myopic Megalomania" can be found when an executive dashboard is constructed without the attention to the data management processes that support the underlying management information system.
Key individuals have a tradition of accepting information only from their own people. In addition, they have a tradition of rejecting any information or data which does not support their position. There may be a distrust of technology, or conversely, a worship of technology.
Information is not available when it is needed. This can happen for a variety of reasons. For example, the user may not be able to specify or communicate what is needed. Or, the provider may not be capable of translating the user needs. Of course, there may be confusion resulting from situations where multiple uses are being made of the information. Confusion can also result from analysis paralysis when a final form of the results does not appear because of the continual analytic churning of the data.
Function: Use and Influence Knowledge
Use of data and information requires user involvement. User involvement anticipates facts which are sufficient, relevant, and timely. The user needs to "learn" the information through a process which increases the user's "organizational intelligence." At this point, the information becomes integrated into the user's knowledge base and reduces his/her uncertainty. It can then be shared with others, used to monitor a situation, make a decision, advocate a position, or confirm a process.
A key part of the use and influence of results obtained from the analysis function is the degree to which these results change the way users perceive reality at their institution. The influence of data and information rests on the amount of change that can be attributed to their use, which, in turn, can increase the knowledge of the various participants and also help identify next steps, unknown components, and data needs. Together, these factors enable the user to clarify beliefs about reality; the way the process works; and, the way it should work.
The data and information must be structured to tie the results back to the conceptual model which was used to guide the creation of the information. The results need to be integrated into the thought and decision processes of the individuals involved in making decisions.
Multiple indicators for a specific situation should give convergent results; however, they should not be redundant. For the information to increase the knowledge or intelligence of the user, it must be useful in anticipating, explaining, or predicting future events. As such, it must be related to the constructs which span the issues related to the institution's success. The user must accept the information and integrate it into his or her
26
knowledge about the key concepts. It must be sufficiently comprehensive to meet needs, be relevant to the situation, and above all, timely. Often, late data are worse than no data at all.
Disease: "Creative Carcinomas." This disease is characterized by creating facts, as needed, where festering sores develop around the lies. Specific facts are allowed to stand and interpretations are modified. There are conflicting purposes. Information that supports one manager may undermine another. Information also may be tainted by the belief that its source is unethical and cannot be trusted. This is particularly a problem for people who use advocacy information in a political environment. For example, if faculty salaries may be presented as low for getting money from state sources so the chances of additional funding are increased. On the other hand, when faculty salaries are used to demonstrate institutional quality, higher salaries may be reported as an indication of higher quality.
Lack of structure may render the information useless. If the needs are not very specific, near random, hard to quantify, and related to personal whims, it is unlikely that resulting data or information will be of value. Statistics in the media are often "explained" after being used. The response of decision makers is often "ready, shoot, aim." There is an executive belief of personal invincibility and skill. In this environment, there exists a tradition of blaming poor data to explain poor decisions.
A Checkup
As noted earlier, a checklist of "healthy signs" is provided in Appendix I. These signs were developed from items identified as issues which limit information quality, and were drawn from workshops we conducted on data management during the past 15 years. There are 20 items for each of the five functions just described. This should give a good feel for the health of each function at a given institution. When we use this checklist at our workshops, the scores range from 2 to 18 with medians around 13 for each function. We suggest a minimum score of 15 to indicate a "healthy" function. This is probably equivalent to a grade of "C." Obviously, while a given function may not pose an immediate problem, a score of less than 15 indicates room for improvement.
It is suggested that the checklist be used with a representative group of custodians and managers. An analysis of all responses will show whether a shared understanding of the way various activities are performed exists at your institution. Do not be surprised if individuals think their areas are in better shape than the group does. After you use the checklist, focus your efforts on the areas with the lower scores.
Usually, the lowest score will be the area which is the greatest limitation to the value of your data.
Improving Data Management
The quality of facts is dependent on the processes used to manage data and information. The information support process is circular (Figure 1). This process is only as strong as its weakest point. If at any point the
27
process fails to provide adequate quality, then the steps that follow will have limited value to the organization. For example, data are usually stored before analysis and usually delivered to the manager before they influence a situation. As such, the function of delivering and reporting information is dependent upon the integrity of collecting and storing data, as well as the quality of restructuring and analyzing the facts. Again, note that the use of facts also uncovers or creates additional areas of uncertainty about which beliefs are generated. The identification of knowns becomes translated into beliefs which relate to the identification and measurement of additional facts. The reduction of uncertainty by the use of information generates the need for additional data and information. It is in this sense that the information support is a circle, an ongoing process, a necessary process if the institution is going to be a true "learning organization."
Successful data management is dependent on advocacy and leadership spread across the roles of Custodian, Broker, and Manager. It is predicated on nurturing new working relationships among people who previously did not communicate or were adversaries. What follows is a discussion of a strategy to increase the robustness of data quality improvement in the current structure while establishing the foundation for the new formal and informal structures needed to deliver quality information. This discussion looks at the operational implementation of each of the three roles: the Custodian (Chapter 4); the Broker (Chapter 5); and, the Manager (Chapter 6). Each role is described in terms of tasks, skills, and responsibilities. We also present important tools and concepts for each role. There is no exclusive linkage of tools to roles.
Rather tools are linked according to primary interest. In fact, we argue that no one role owns a tool or area of activity. Individuals in specific roles, however, are likely to be assigned the leadership responsibilities for a group of activities and tasks while attempting to orchestrate events supportive of the overall, organizational data management processes.
CHAPTER4
THE CUSTODIAN-DEVELOPING THE DATA RESOURCE
What are the people processes that build in quality for the new corporation? It's the open, networked enterprise of professionals working together in multidisciplinary teams that cut across traditional organizational boundaries and that are externally focused on the customer. The model is based on commitment rather than the military's model of command and control. (Tapscott, p. 35)
The data custodian, or data supplier, is responsible for collecting and supplying the data. The custodian is associated with the organizational unit vested with operational responsibility for a specific set of organizational activities. The Registrar, for example, is often the custodian of student data. In a distributed environment, he or she may be responsible for the activities of entities which gather student data but may be totally independent of the computer operations. In this case, the Registrar will be the custodian of student data even though the computer center is responsible for the computers and the programmers.
The custodian concept recognizes that individuals do not own the data. Individuals are, however, responsible for the data being of value across the entire organization. While custodians' specific responsibilities may vary, they usually include data collection, database management, and appropriate backup and recovery procedures. Or, these responsibilities may rest with technical personnel who are part of the computing center. Whether or not custodians are directly responsible for these duties, they are responsible for ensuring the duties are performed. This means that custodians need resources and/or the authority to meet their responsibilities. These responsibilities become more complicated as technical personnel are placed in different locations and the custodian lacks direct access to technical personnel.
Custodians are the essential organizational actors insuring the reliability of the data. They must control random influences in the collection and storage of the data that can destroy the consistency, the stability, and the objective nature of attributes being captured. They are also responsible for properly documenting the data collection and storage. Finally, the custodian must insure that standardized re-coding is used as part of creating cyclic file extracts of the operational data for inclusion in the organization-wide repository, or data warehouse.
Custodial responsibilities for institutional data are part of management and frequently are delegated to system support stewards within a functional area or to a central computing function. These distributed activities are the basis of an organization's data management function. Obviously, the custodian who is lacking in technical personnel must be otherwise supported by appropriate technical and personnel resources.
29
Data Custodian Tasks and Activities
The custodian is responsible, and accountable, for the following primary tasks and activities:
Data Standards and Documentation. Custodians must work with the data management group and others to develop and implement standards for selection, standardization, integration and accessibility of organization-wide data. They carry responsibility to incorporate and document these standards. Business rules defining how derived variables or elements are created and categorized are also important tasks that need to be accomplished.
Data Collection and Storage. Custodians must assure reliable data collection processes, maintain a list of allowable values, and archive data at standard cycles. This may also include developing census date data and functions.
Data Validation and Correction. Custodians implement and document validity checks and documentation for applications that capture, update, extract, transfer and load, or report critical data. They develop and measure data quality and respond by repairing erroneous data, adjusting the processes that created erroneous data, and notifying impacted users of the corrections.
Data Security. Custodians should implement and document access procedures to provide adequate protection as determined by management and monitor violations. They implement backup and recovery procedures that protect against threats to data integrity arising from system failure, faulty manipulation, unauthorized intrusion, or other disasters.
Data Availability. Custodians provide accessible, meaningful, and timely machine-readable data which clearly identifies collection and modification dates and procedures. They work with central data management to provide training and consulting on data use and solicit input for improving data quality and delivery.
The Underlying Organizational Support
As we begin discussing data standards and data administration, it is important to understand underlying organizational structure. Standards must emerge from the various functional areas to be integrated. This effort should be coordinated by a central data management function focused on producing management information. As such, this producer is in tum the custodian of a central data repository which contains important parts of the organizational data extracted cyclically and stored in a standardized form. This activity often includes running the organizational data warehouse with varying levels of responsibility for acquisition and distribution.
30
Establishment of an ongoing process for managing standardized data in terms of edit, validation, update, alteration, audit, correction, and distribution is critical to data management. Standards for these functions can be met where the institution creates appropriate conditions that incorporate the Shewhart Cycle (Gitlow & Gitlow, 1987) for continuous improvement (Figure 5).
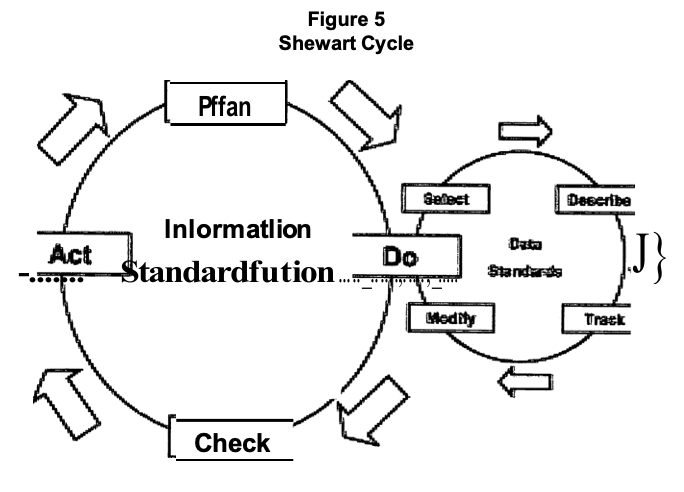
The following set of activities (Plan, Do, Check, Act), structured within the Shewhart Cycle, are necessary for the support of data management.
Plan-Data Management Structure
• Identify and establish an official source for critical entities with a list of standard values for key attributes (This is the beginning of a centralized data repository.)
• Assign data custodial responsibility and accountability
• Establish and implement policies that balance accessibility with security
Do-Data Standardization
• Standardize and distribute data descriptions, definitions, and documentation
• Apply consistent definitions over time (historical data)
• Cross-reference all occurrences of a data element across the organization
31
Check-Processes and Procedures
• Implement systematic edits and validation to ensure completeness and accuracy
• Establish audits for accuracy and measures of accountability
• Develop a process for reporting the results of the data edits, audits, and checks
Act-Implement and Monitor Data Access and Data Use
• Create query capability to identify data sources and data modification procedures
• Ensure the retention of historical data as well as ready access to timely and historical data by trained users
• Survey users to measure the extent that data usage is clear and meaningful
For these processes to assure data quality, all stakeholders suppliers, producers, and users-must be involved at different points in data management processes. This requires that: (1) the operational offices supply reliable data; (2) the central data management function integrates and refines the data into a usable form and produces internally consistent information; (3) the customers have access and training such that they can generalize the information they receive to their needs and situation; and, (4) the three groups communicate, coordinate, and cooperate.
The Customer Driven Data Architecture
Architectures should be 'stolen', not reinvented ... to the extent that data architectures are stable over time within a company, they should also be quite similar across companies within an industry. (Goodhue, Kirsch, Qui/lard, and Wybo, p. 25)
As managers must respond quickly to change, they require data that can provide relevant current and longitudinal information from both internal and external sources. Accurate assessment of a situation is necessary to justify and formulate plans for change. Trend data is critical for planning and goal setting. Self-assessment data is necessary for measuring productivity gains. These data needs should be identified and developed into a data architecture that encompasses what the organization needs to know in order to do its business and remain competitive.
In addition to supporting analysis that blends data from the past and the present and anticipates the future, the data architecture must allow expansion and addition of functions over time. It must also be an
32
architecture that can be readily transported to a variety of platforms and software systems in order to take advantage of increasingly more effective technologies as they become available. Organizations with a data architecture that is flexible and responsive to innovation are positioned to take full advantage of opportunities to improve efficiency.
When the data architecture of an organization does not support its needs, the results are rather obvious in that numerous activities are implemented at the last minute to get numbers and these emergencies seem to reoccur. The organization can respond in one of three ways:
Masking occurs when discrepancies or insufficiencies are ignored or massaged, thus allowing a weak data architecture to prevail and the organization to suffer the consequences of continuing to manage with poor quality information.
Coping arises when local or personal systems are developed in response to unmet information needs, creating a spider-web data architecture that fails to adequately support either local or enterprise-wide information requirements.
Correcting begins when quality data from the enterprise's systems are demanded and the organization accepts responsibility for stabilizing and strengthening the data architecture for the whole enterprise. The last response to poor data can be the beginning of customer-driven data architecture.
Today's managers understand the challenges of evolving data architecture, perhaps better than the traditional computer systems professional. Not only have the managers endured the unpleasant experience of receiving multiple and incompatible answers from their major information systems, they have also created their own nightmares. In their local or personal computing environments, they may have failed to maintain sufficiently granular data in terms of frequency of capture or level of summarization. Though few would admit it, most also have found it difficult to use data they have collected because of inadequate documentation. Additionally, these managers have struggled with data discrepancies for years while the organization's programmers cranked out code to process whatever data existed and considered their job successfully complete if the program ran without errors. When there are staff changes, new managers often take forever to learn the data and their use(s).
People who manage a function or organizational event have a vested interest in the productivity of support processes. They are primary stakeholders. Their success is determined by: (1) how accurately they anticipate and identify the customer and the customer's needs; (2) how effectively they meet the customer's needs; and, finally, (3) how convincingly they are able to measure their success and apply what they learn to further improve the process. While this view of success
33
anticipates change, it also has a foundation of stability based on a data architecture that provides point-in-time quality baselines-or standards. Ultimately, the standard is really an outgrowth of information producers identifying and responding to customer needs.
Data Administration and Data Standards
In the early seventies, many information systems organizations created a central data administration department to help develop, distribute, and enforce minimal standards and to ensure that our systems could work cooperatively. Since most of these early systems were developed and used internally by a systems development group and usually for one database management system, the focus was on securing, cataloging, and standardizing database definitions. A data dictionary was often closely coupled and integrated with the particular database management system in use. Today, we are more likely to hear about Information Resource Management than Data Administration. The function of managing data now goes well beyond the initial database support function of most early data administration departments. The Data Administration Standards and Procedures Working Group of the Data Administration Management Association (DAMA, 1991) proposed the following mission statement:
• To combine activities, standard methods, human resources and technology for the central planning, documentation, and management of data from the perspective of the meaning and value to the organization as a whole.
• To increase system effectiveness by controlling data through uniformity and standardization of data elements, database construction, accessibility procedures, system communication, maintenance, and control.
• To provide guidance for planning, managing, and sharing of data and information effectively and efficiently in automated information systems.
This mission clearly has relevance for the information management issues we face today. It is significantly more expansive than earlier mission statements by describing an essential management function to optimize information resources. It generalizes to our changing organizations even as technology rapidly changes, users become more diverse and increase in numbers, and the information support environment becomes more distributed and complex.
It is also recognized in this mission statement that, while people who manage data must be acutely aware of evolving technology, the data management function itself is not driven by technology. In fact, the reverse is true. Effectively managing data focuses on building a stable information resource that can be quickly adapted to technological innovation. Moreover, with people throughout the college creating,
34
|
Table 2 The Ten Commandments of Data Administration |
|
1. The first rule is that there are exceptions to every rule. No standard is appropriate in every situation. However, the data administration staff must not allow exceotions to become the norm. |
|
2. Management must support and be willing to help enforce standards. If standards are violated, management must assist in assurina that the violations are corrected |
|
3. Standards must be practical, viable, and workable. Standards must be based upon common sense. The less complicated and cumbersome the standards, the more they will be adhered to. Keeo standards simole. |
|
4. Standards must not be absolute; there must be some room for flexibility. While some standards must be strictly adhered to, most standards should not be so rigid that they severely restrict the freedom of the data desianer. |
|
5. Standards should not be retroactive. Standards are to control and manage present and future actions-not to undo or redo past actions. In most cases, standards enacted today cannot apply to data desian that beaan several months aao. |
|
6. Standards must be easily enforceable. To achieve this, it must be easy to detect violations in the standards. The more the process of auditing for the compliance of standards can be automated, the more effective the standards will be themselves. |
|
7. Standards must be sold, not dictated. Even if upper management wholeheartedly supports data administration standards, the standards must be sold to employees at all levels. Data administration must be willing to advertise the standards to all employees and to justify the need for such standards. Data administration standards demand that programmers and analysts change the way they design data. Any lasting and meaningful chanae must come from the emolovees themselves. |
|
8. The details about the standards themselves are not important-the important thing is to have some standards. Data administration must be willing to compromise and negotiate the details of the standards to be enacted. |
|
9. Standards should be enacted gradually. Do not attempt to put all data administration standards in place at the same time. Once standards are enacted, begin to enforce them, but do it gradually and tactfully. Allow ample time for the non-data administration staff to react and adjust to new standards. The implementation of standards must be an evolutionary, rather than revolutionary, orocess. |
|
10. The most important standards in data administration is the standard of consistency-consistency of data naming, data attributes, data design, and data use. |
managing, and disseminating electronic information, data quality must receive attention throughout the college. This attention must go well beyond control activity within the information systems organization and be understood and embraced by all of an institution's management. The term "data management" recognizes the fact that managers and technicians alike throughout our organizations must manage data and attend to the quality issues. Miselis (1990) makes the important point that in as much as information is an institutional resource developed and used campus-wide, the management structure charged with ensuring that there is an effective and efficient use of computerized information should also be campus-wide.
Standards are the foundation of responsive, yet stable, data architecture. The essence of standardization is the adoption of a common language that enables shared understanding and provides capability to integrate multiple data sources. As such, it is a never-ending process that continually improves the quality of the information resource. The process of continually improving the quality of information begins with a set of values. Durell (1985) provides an excellent perspective on these values with "The Ten Commandments of Data Administration Standards." We include them in Table 2 as a guide, to help make us more realistic about our undertaking.
The Information Resource Dictionary
The primary tool to implement standards for a customer-driven data architecture is the Information Resource Dictionary (not a data dictionary). This dictionary should be relational in design and includes these characteristics:
• Support a standard query language
• Be compatible with transaction-based systems, and also with data migrated to the data warehouse
• Contain a data dictionary which supports identification of common data elements across multiple systems
• Contain meta-data (data about the data which describes a data element, where the element exists, how it is referenced, how it is validated, how it is stored, how it is reported or used)
• Define any access restrictions associated with the data elements and who has custodial responsibility for specific data elements
The Information Resource Dictionary supports a broad base of users that includes data administrators, data custodians, system managers, security administrators, auditors, and end users. It plays a key role in promoting understanding of data across systems and organizational entities and in providing a central reference for data edit and
36
validation rules, as well as the data standards discussed above. The Information Resource Dictionary contains the entities and attributes from the source systems along with the predefined attributes and text from the custodians describing and defining the data. Dictionary entities include, but are not limited to, data elements, files, records, systems, programs, modules, documents, and users. The Dictionary identifies relationships between these entities, including predefined attributes of each relationship. This includes short descriptions, high-level descriptive definitions, and detail processing descriptions to support drill-down analyses in which data are mined from the general to specific.
Clearly operational, managerial, and executive personnel must buy into the belief that improving data quality is worth the investment of time and money. We suggest investing in the following integrated methodology which produces a product that has value and can be marketed. This methodology is an integrated tool set (Figure 6) that has four sequential supporting parts: (1) People who perform activities; (2) Activities that utilize data; (3) Data that are manipulated using tools; and (4) Tools that assist with creation, reference, update, and deletion of data (Tasker). Each element in the tool set needs to be engaged to assure that the institution effectively manages its data and thus has quality information. The overall efficiency of this methodology in terms of sustaining quality information systems can quickly justify the costs involved.
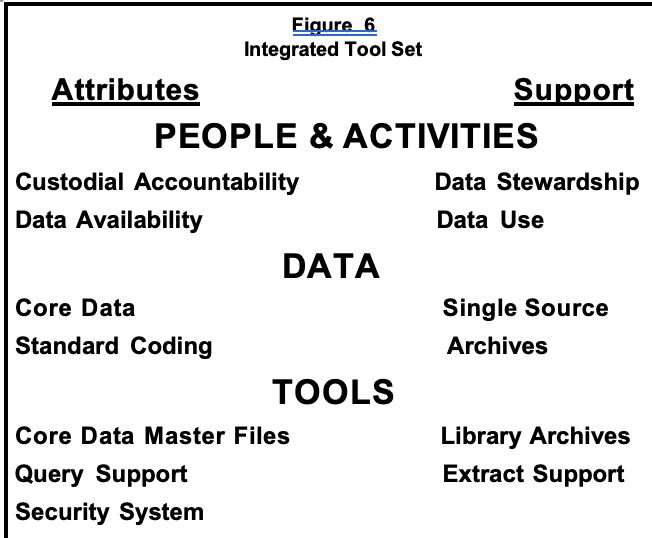
People and Activities
Data Custodial Accountability. There must be someone in charge of each data element. This individual does not own the data, the institution is the owner and the data are a resource. The custodian needs sufficient seniority to make policy decisions about the use of specific data resources and data management. These people are traditionally senior officers at the institution who have managerial authority over functional areas that create and manage major data systems.
Data Stewardship. The custodians must assign data stewards - operational staff - who are responsible for data administration within a specific set of elements and codes. The data stewards assure proper collection, storage, and editing of operational data for completeness and accuracy.
Data Availability. The data must be made available, balancing security and access to all authorized users. This accessibility is the responsibility of the custodians, working with information systems and other operational personnel.
Data Use. Data use is governed by institution policy. The authority to change policy resides in the organization's management processes and transcends any given custodian. Coordination of data use policies should be done either by, or with the advice of, a data advisory committee.
management of the institution. These variables may number some two to three hundred out of the thousands used in the various operational systems. Standards are applied only to these important data elements.
Single Source. A single official source is assigned for critical entities and codes such as those defining a facility or department. A list of standard values is created for each entity which includes, at a minimum, a standard code, a long name, a short name, and a standard abbreviation.
Standard Coding. There must be a standard and systematic manner for describing, defining, and documenting each variable. This includes conversion to various coding categories and the mappings of various data restructuring based on historical activities and reorganizations.
Archives. Historical data files should exist and be accessible.
These files should be time stamped for proper interpretation and use, and should include secondary data structures used for official reporting and analyses.
38
Core Data Master Files. The management data of the institution should be stored in a centralized database for authorized use. This database should have a data dictionary and be accessible by multiple users.
Library Archives. Historical data need to be stored in an accessible database structure. Crosswalk tables should be available in the same structure that reflects changes in official coding over time.
Query Support. Various languages should support generalized queries of the availability and interpretation of the data stored in the centralized database.
Extract Support. Procedures should exist for the extraction of data from various repositories and databases, share and evaluate and then analyze. This extract capacity should include the ability to select either subsets of data or to focus on specific variables or data elements. Also, extract procedures should include standardized business rules on recodes and the ability to move data into various secondary data structures, server, and desktop environments.
Security System. The data should have subset, variable, and user identification security capability. The security should be consistent with that used for non-computerized files. Access should be the default.
Online Analytical Processing (CLAP). Often set as a matrix called a "cube" that has user defined columns and rows. These also often have the ability to "drill-down" by clicking on a category.
Business Intelligence (Bl) Tools. A broad range of somewhat intelligent methodologies for searching for and/or demonstrating trends, interactions, or other such artifacts in the data.
Extract, Transform and Load (ETL) Tools. Used to remove data from its primary source structure, modifying it using business rules, and loading the results as data into a secondary repository.
Enterprise Tools. These tools normally occur with various sets of abbreviations such as ERP, CRM, and other identifications. They also integrate the tools with the data sets and all funds are enterprise operating systems.
Standardization and a Centralized Administrative Database
A centralized administrative database (Figure 7) referred to as the ADB (Administrative Database) contains elements which are the core data important to the operations of the institution. Specifically, an element is included in the ADB if it meets any one of the following criteria:
39
• It is relevant to planning, managing, operating, or auditing major administrative functions.
• It is referenced or required for use by more than one organizational unit. Data elements that are used internally by a single department or office, are not typically part of the ADB.
• It is included in an official institutional administrative report or survey.
• It is used to derive an element which meets the criteria above. Data elements, which meet at least one of these criteria for
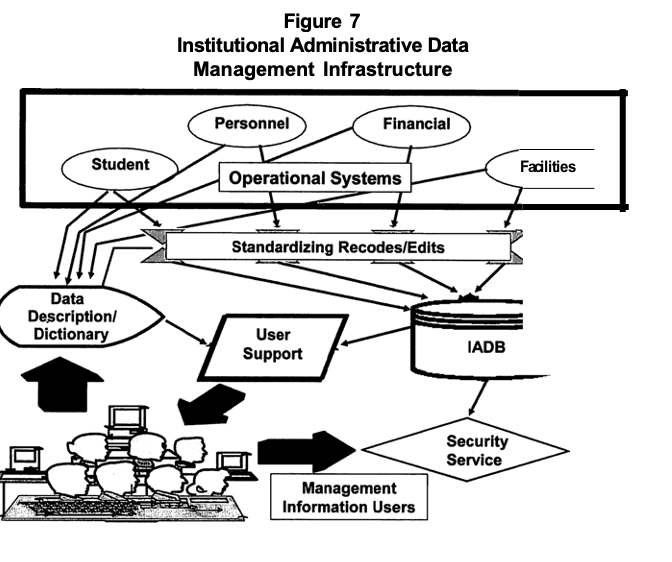
inclusion, become a resource for the management of the institution. A data custodian, a data steward, or a user may identify them for inclusion. At times, a process of resolving disagreements will be required, as the inclusion of a data element in the ADB will often place additional responsibilities on the custodian and result in the loss of some autonomy in handling the data element and its codes.
Key variables are an important component of the ADB. These are the variables which are used to link databases. They typically include such elements as an official building number, a personal identification number, or a course identifier, which can be used to link student and instructor for a specific instructional activity. Key variables should have a standard code, a standard long name, a standard short name, and a standard abbreviation. Every occurrence of the key variable should
40
contain one or more of these attributes. Aliases should never be defined as key variables.
For example, in addition to the standard code, standard long name, standard short name, and standard abbreviation, the Facilities Master Data Tables of the ADB can include other attributes required by other organizational units. These are included elements required to check consistency with other data sources and elements required to maintain historical representation such as status flags, begin dates, and end dates. Master Tables like the Facilities Master Data Tables should be accessible and readily available to anyone with a need to know the information. The Master Tables should include general information about each element, a definition for data processing each element, and documentation for assigning and maintaining each data element and its attributes. The custodian should be given the resources necessary to maintain the Master Tables in their care. This responsibility includes developing procedures for:
• Maintenance of data items in the Master File to include editing and auditing the data
• Information dissemination about changes and updates in the Master File
• Implementation of procedures for archiving information from the Master File to include census extracts with time-date identification
• Coordination of changes, additions, and deletions to the key variables and codes
In the standardization of the data, the data should be checked for four major types of errors:
1) There needs to be data present for the required attributes of the entity.
2) The data that are present must be in the allowable range or as an allowable category.
3) The data that are present must be in a category that is consistent with the data that represent related elements. For example male students should not have a campus address in the women's residence hall.
4) The data that are present should have a reasonable likelihood of occurring. For example students who are paying out-of-state fees should in general have out-of-state addresses.
A Prototype for Standardization
The events outlined above require time and effort to achieve.
Furthermore, they depend on the interaction and cooperation of numerous individuals who are not accustomed to working with each other. The best way to develop momentum across the campus for these
41
events is to do a prototype project. The following is a description of a prototype project completed for the development and implementation of standards on facilities data and information.
The data custodial office, Facilities Planning and Construction, was involved throughout the process. The data custodian and data steward participated in each of the following steps of the iterative-Plan, Do, Check, Act-quality improvement cycle:
• Identify critical and key university elements and codes-Plan.
• Define and document data elements and related codes-Do.
• Measure and verify data and code quality and integrity-Check.
The first result of executing this cycle was a draft of a Facility Master File, which is the official source of facilities data. The Facility Master File contained: (1) Key Variables-the data elements that provide validation and translate capability; and, (2) University Core Data-the data which are required to answer university-wide questions and should be generally available from a central data source, in this case the ADB. This prototype provided a basis for the next steps in the development of an institution-wide data warehouse -Act.
Making the Custodial Job a Success
If you find yourself taking on the responsibilities of a Custodian, the discussion above outlines the specific tasks that you will ultimately be held accountable for completing. To facilitate the accomplishment of these tasks, you may want to check the degree to which the data and data management function is meeting customer needs and then set priorities to meet these needs. In addition, review data management policies, procedures, and existing priorities with the data stewards and clarify those which are unclear and develop new ones where needed.
Technical shortcomings need to be identified and rectified as soon as possible. Look to colleagues at other institutions or in professional organizations for tools and technology that have worked in settings like yours, and, finally, join one or two technical groups such as EDUCAUSE or the Association for Information Technology Professionals to stay up-to date with technical developments.
As an organization develops and refines the roles of the custodian, with the central coordination and implementation of standards, the key parts of the centralized management database will increase in value. The use of the tool kit needs to occur with the assignment of custodial and steward responsibilities. The creation of the architecture and standards should be consistent with The Ten Commandments (Table 2). As the custodian improves the process of capturing and storing the data, the broker will have more opportunity to add value to the data. The broker's role is described in the next chapter.
42
CHAPTERS
THE BROKER-TRANSFORMING DATA INTO INFORMATION
One of the most difficult leadership challenges is deciding when to stop formulating strategy and begin executing it. Although many executives are action-oriented, the computer has increased our fascination with data and our ability to manipulate data. Top management teams now have access to voluminous performance statistics, market research reports, and other business information. In many cases, these data seem to hold senior management spellbound. Couple this data overload with even more sophisticated techniques of financial analysis and you have the "analysis paralysis" strategy trap-the inability or unwillingness of executives to take decisive action. (Stringer, p. 77)
The data in the university's transaction systems must be transformed and analyzed before they are useful in decision making. Managers can easily become trapped by the "analysis paralysis," described above, if they are bombarded with volumes of data that have not undergone systematic analysis and refinement. The way to avoid analysis paralysis is to have an effective broker function. After the data are standardized and stored in the core master files of the institution, they need to be restructured and often merged with other data-the role of the broker.
The data broker obtains data from various data sources and transforms them into information. The broker adds value by using structured procedures to give the raw data meaning in the context of management needs. The broker is often someone in the institution who is performing a traditional institutional research activity of analyzing data and developing useful management reports. This requires the ability to interpret the data and determine the type of analysis needed. This may also involve restructuring the data to make them more consistent with the business rules of the institution. The basic steps involve accessing the data, aggregating and summarizing them, merging them with other data, sub-setting and creating appropriate variables, and making the results available in forms which range from a subset or extract of the database to a highly summarized and possibly synthesized performance indicator report. Success depends on coordinating the data management functions.
Coordinating Data Management Functions
Brokers require support from the institution to be successful. Those functions that need to be coordinated with the broker's involvement are defined below:
43
Information Planning
• Works with operational area managers or custodians, data stewards, and distributed users to maintain and share a model of the data elements and their attributes important to the organization (the Core Master Files).
• Helps anticipate and respond to users' changing information needs. The collection of new data or the modification of existing data takes time and is best done in a rational systematic fashion. If changes in data elements required to support key decisions can be anticipated, "panic" can often be avoided.
• Coordinates policies for the population and use of longitudinal data in the institution's data warehouse or central store of core data. A key issue involves balancing access with security. A general rule is that the restriction of data limits knowledge and is not desirable. No data should be restricted without a legitimate reason.
Standards Administration
• Develops and coordinates the implementation of standards for the data elements and codes in the warehouse. There should be a code for each data element. The code should be one of the predefined allowable codes, and should be consistent with other codes. For example, each student should have a code for "home state," this home state code should be one of the allowable state codes, and in general students from the institution's state should be paying in-state fees.
• Works with distributed users, operational area managers, and information technology personnel to establish and implement data management policies. These policies could identify the organizational units responsible for editing the data, changing passwords, and correcting errors. These policies could specify the procedures for adding new elements and codes.
• Provides standards and appropriate documentation for use by electronic data processing (EPD) audits. This includes steps taken to secure institutional performance data in compliance with federal and state laws. This also includes disaster recovery plans, and procedures used to ensure data integrity, such as backup and recovery.
• Maintains an inventory of official code definitions and values for standardized data. This inventory is used by custodians to ensure that standardized data are populated in the data warehouse. These codes need to be archived and time dated.
44
Processes need to be developed for changes in allowable codes and, as such, each code must have a start and end date.
Operational System Management Support
• Assists custodians of functional operational systems in extracting, standardizing, and providing data for the data warehouse. Timing is critical. Procedures should be similar across operational systems even if the operational systems reside on different platforms and in a variety of database management systems.
• Assists managers of operational systems in developing and maintaining data elements and definitions. This should involve some institutional standard for entering, updating, and distributing data about data (meta-data).
• Provides limited training and advice to operational managers about developing and preparing individuals for data management. This could include an orientation session, an electronic forum for sharing information, and a hot line for help. It is critical that the custodians and stewards feel comfortable making quality improvement suggestions to the broker and the manager.
• Helps operational managers create and coordinate user groups for key functional areas. These groups are key to rapid and effective communication about ways to add value to the data. User groups also provide and legitimize advocacy for change and promote shared discovery and learning.
Administrative Services
• Coordinates the identification of issues and strategies for dealing with data and information management. This positions the data management function strategically, allowing it to manage change rather than simply react to problems.
• Supports a process that improves data quality with a baseline of standards and measures of improvement. The interest of the key stakeholders usually will focus on current hot topics. If a topic involves improvements in effectiveness or efficiencies, the manager can show how improvements can sustain executive interest.
• Organizes and provides administrative support to an information policy steering group which includes personnel from the information technology function, the central data management function, operational area managers, system support stewards, and distributed decision makers or users.
45
• Organizes and provides training and administrative support to distributed decision makers who wish to use data that are in the data warehouse. This may involve some training in the use of data and/or information in decision making.
• Leads focused cross-functional projects on data quality improvement.
Data Administration
• Manages the data warehouse, serving as custodian and system steward for the warehouse. The task of designing and loading data into a data warehouse requires understanding and documenting the business rules. It also involves the creation of new "business-oriented" data elements, and the creation of meta-data. The data warehouse is actually a collection of master files that requires custodian and steward support.
• Supports creation of a consistent and usable set of data warehouse data elements. This requires a standard process for managing changes in codes and data elements.
• Where necessary, mediates user and operational area custodial concerns about codes and data definitions. These groups have different responsibilities within the institution. They have different professional skills and values. As they act in their own best interests, conflict will result and require resolution.
• Distributes information about the data warehouse and its use. Educates customers and potential customers about its availability and value.
• Ensures proper archiving and protection of historical data in the warehouse. This results in the ability to use standard data over time. It involves ensuring that historical data are accessible. Information about accessing historical data should be part of the meta-data.
• Acts as the official source of the audit trail which delineates changing codes and data element descriptions for elements in the data warehouse. Detail should be accessible to at least one level below the current definitions and values.
• Maintains all information management policies. Since these documents are specific to organizational units, they need to be updated as individuals and units change. Management policies will also change as technology changes and should be reviewed annually.
46
End User Support
• Uses the data warehouse to respond to user requests and develops useable prototypes. A log of ad hoc requests to track emerging needs should also be maintained.
• Helps communicate users' information requirements to management and to the operational areas. User requests can be combined when users need similar support.
• Supports users' needs to integrate locally maintained data with the data in the data warehouse. This requires creating data set extracts, often supplying them to users.
• Assists with migration of users' local data to the data warehouse when it is relevant to activities, analyses, or reporting that crosses functional boundaries. Student outcomes assessment activities may require mailing addresses from the Alumni Association. These same mailing records may also be needed by departments wishing to form advisory councils. When multiple groups need the same set of data, steps need to be taken to integrate it into the data warehouse.
Technical Development
• Works with operational area managers or custodians, system support stewards, and end users to clarify technical needs. The institution can profit from having similar users using similar tools.
• Supports the information technology department in the development, purchase, and use of prototype tools and products for managing and delivering data. This provides user input to the selection of tools. It also allows for the investigation of prototypes by individuals with a vested interest in learning how a tool can help add value to data.
• Acts as a clearinghouse for data management tools and related technology. This activity includes shared learning with similar functions at other institutions and businesses.
The Data Warehouse
The term warehouse is used to imply a secondary or derived data structure. These structures are often named "data mart, "operational data stores," or something similar, based on their level of integration and/or their completeness. To simplify this discussion, all of these secondary integrated and often times recoded data structures will be referred to as data warehouses. "Legacy" systems challenge data management. Old systems often use different database structures, run on different hardware platforms, and are under the control of many different areas of
47
the organization. At best these would be considered as decentralized. They must be centralized, standardized, and then they can be distributed as data warehouses. Under funded and under fire, data management has not been a story of successes during the past decade. Faced with these challenges, Bill Inmon (1993) developed the concept of the data warehouse in the early 1990s to solve some of these problems. The characteristics of the data elements found in databases are presented along with the relationship of the data warehouse to other primary databases (Figure 8).
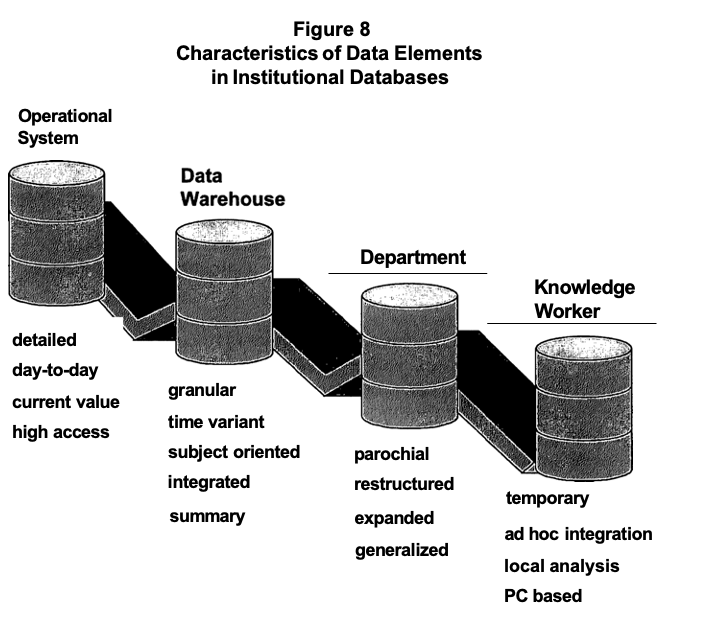
A data warehouse is a collection of data from many systems brought together to support the needs of management. It is a "user friendly" version of the institutional research collection of census-date data sets. The data warehouse provides a "business view" of the data, and addresses the following problems with legacy systems:
Data Access. Access to data is difficult in legacy systems due to the lack of documentation and definitions, complex security, and differences in the hardware and software environments of the source systems.
Data Integration. Data integration is difficult because of the lack of
48
standard codes for university-wide use, different edit and audit criteria, and the different time cycles for extracts. Data integration can also be difficult because organizational factions prevent its use as a university resource.
Data Recoding. As data are brought forward and summarized into the appropriate table structure comprised of the primary elements, it is often necessary to recode the elements into the categories needed by the users.
Data Availability. Data availability is often inconsistent. Definitions differ across various systems. Both the systems and the management needs are constantly changing, usually independent of each other.
Data Integrity. The volatile nature of transaction-oriented operational systems, coupled with the lack of code standardization, contributes to significant challenges to data integrity.
Characteristics of the Data Warehouse
The data warehouse (Figure 9) is always physically separate from the application or operational databases. It is designed to support information inquiry and analytical processing. Elements in the data warehouse should reflect the characteristics defined below.
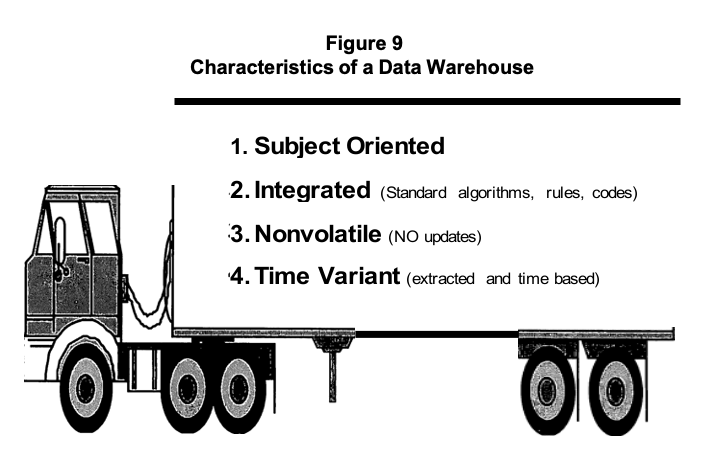
Subject Oriented. The data in legacy systems are frequently organized around the application or transaction. Student data are organized by administrative processes or applications, such as admissions, registration, or student accounts. A subject orientation might be a student, a course, or a faculty. This begins to pull operational data together with a business view that supports management requests for such things as faculty workload projections.
49
Integrated. Integration is the most important aspect of the data warehouse. It is critical to virtually any analysis. It is also the most difficult and time-consuming aspect of building a warehouse. Integration requires consistency in naming conventions, coding structures, and in physical attributes. Over the years, application systems have been designed for specific functions, in specific areas, with little thought given to other related units. Data elements that are used in multiple areas commonly have completely different coding schemes. The warehouse brings together data extracts from various systems and translates the data into a single entity. A single coding scheme must be chosen for the warehouse, while allowing individual operating systems to continue to use their own schemes. Integration requires checks for consistency. An example of the need to integrate the data by subject is the development of data to support research about students, which involves class performance related to faculty characteristics over a time period of several years. While the unit of interest is the student, student data, curricular data, and faculty data need to be integrated. With independent legacy systems, the project would be a daunting undertaking. In a properly constructed data warehouse, the data would already be integrated.
Nonvolatile. Application or operational systems are continually changing to reflect the most recent transaction. Operational transaction systems are designed to answer the questions: Where do we stand right now? or What is the most recent event that has occurred? The characteristics, codes, attributes, and other data characteristics are very temporary or volatile. The operational data system is typically updated nightly. In the data warehouse, snapshots of data are maintained for a length of time. This length of time is determined in a tradeoff between the demands for historical data and the capacity to store a large mass of data. This is similar to determining how long books stay in current publications' stacks before they are stored in the library archives. After the data have reached a specified maturity, they are moved to an archive. Because transaction level detail is of little value after the fact, the data in the warehouse are typically summarized. This also helps with storage issues. Summarizing may also resolve various issues (privacy and disclosure), resulting in the reduction of necessary access controls.
Summarization places an additional requirement on the archiving process. The procedure used to summarize the data must also be time dated and stored. For example, "In 1994, the following departments were in the college of engineering: ..." needs to be available for administrators and faculty in 2004 who need to review the history of productivity of the college as restructured in 2000.
Only the elements from the operating systems that have lasting value for assessing the operations of the organization are summarized and archived. This is not a serious issue if one has been through the process of developing Administrative Database Master Files mentioned in the preceding chapter.
50
Time Variant. The data in a legacy system are accurate only at the time of extraction from the operating files. The data in a warehouse reflects a census date and does not change. If you count the number of students in the registrar's operating system on Monday, that same count on Tuesday will almost always be different. Because the census date database does not change, a count of the number of students will result in the same number regardless of when the count is taken, remaining conceptually correct until the next census date. The specific time of the census date is contained with warehouse elements. This is sometimes known as the time-date stamp and identifies the census date to the user. Data in a data warehouse are not updated, but rather another census extract is added to the warehouse on a predetermined schedule. The warehouse is simply a long series of data snapshots.
Data Flows
In developing the data warehouse, five types of data flows must be considered. Richard Hackathorn, (1995) described these flows in Data Warehousing Energizes Your Enterprise. The flows are related to the Information Support Circle illustrated in Figure 10.
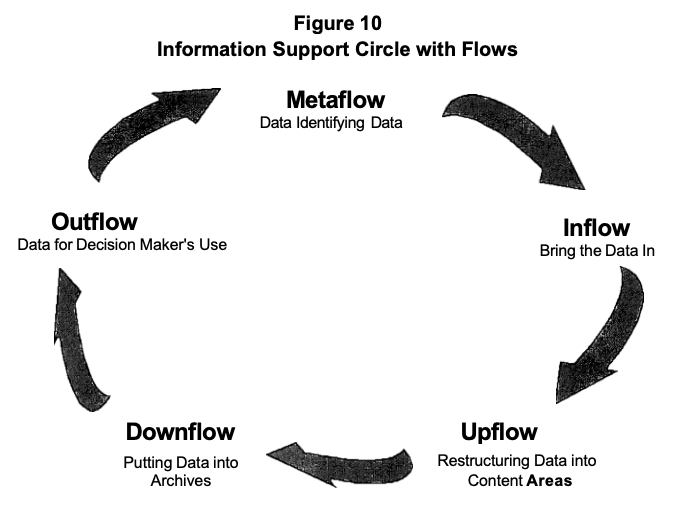
The Metaflow (Identification and Measure) is the process that is comparable to the identification and measurement of concepts. It is the culmination of the flow of data about the data. The Inflow (Collect and Store Data) of data brings the data to the warehouse from the operational systems. The Upflow (Restructure and Analyze Facts) of data combines and summarizes the detailed data and merges the various attributes around a subject-oriented structure. The Downflow (Deliver and Report
51
Information) archives the elements, and the Outflow (Use and Influence Decisions) moves the data to the user. The quality of these flows depends on the quality of the steps taken to standardize the data and the codes described above. The quality of these flows also determines the value of the data to decision makers. Below are detailed explanations of these flows.
Metaflow. The process that moves meta-data in and through the warehouse to insure that data about data are available with the various flows is metaflow. Four activities are required to support metaflow.
System modeling defines the structures and processes of the operational systems which are relevant to the warehouse. This should come as part of the code standardization process. Regulating is the process by which the appropriate person captures, validates, transforms, and relates key data to the relational form of the data structure. Synthesizing creates higher order data elements such as a data element defining "faculty," which is a flag derived from three- or four-data elements. Business modeling develops the rules of the organization's management, which can then be associated with the rules of the data warehouse to map the data architecture to the business architecture.
Inflow. Consolidating data from functional operational systems is called inflow. It involves obtaining operational data, ensuring the standardization and cleaning processes were appropriate, adding fields to identify key group membership, and summarizing unnecessary detail.
Providing for this flow will produce data of some level of correctness, where the amount of effort spent cleaning the data is a management decision, balancing the level of correctness against the risks of using data which are less than perfect. Inflow can also include data brought in from external sources. For example, the average starting salary for faculty, from an external faculty survey, may be merged with the record of newly hired faculty at the institution. The inflow process will rapidly identify missing key variables and the lack of standardization.
Upflow. Combining, summarizing, and aggregating data into subject areas in the warehouse is upflow. The data are rekeyed to critical variables, often the key variables identified in the standardization process. For example, facilities data may use the key of "building" in the warehouse while in the application system "room within building" is used. The upflow process summarizes data from all rooms which are in the same building. This process also involves prepositioning data so subsets may be distributed to departmental warehouses. This includes restructuring the data into more accessible formats such as spreadsheets, graphical presentations, personal databases, and text documents
Downflow. The process of archiving the data is downflow. This results in more highly aggregated data being stored in a hierarchical
52
archive, where it can be obtained for trend analyses and comparative studies. As noted earlier, there is a tradeoff in the amount of detail maintained and the amount of resources required by the archiving process. Similarly, it must be insured that the data warehouse is not populated with low-value data slowing performance and adding maintenance costs. As noted, it is good to store one more level of detail than is typically required by the decision makers and accompany the data with current cross-walk tables and time-date identification. The data element definitions must also be stored and custodial responsibility assigned. The need to control access to archived data is less stringent than it is for the operational systems because the data in the warehouse are "read" only and the summaries mask some of the detail. However, the issues of data sensitivity do not completely disappear, particularly with student data.
Outflow. The process where data becomes available to the customer is outflow. The two activities at this step are accessing and delivering. The components of the delivery function also include some of the capability which support reporting where the delivered data are interfaced with information about specific situations. Reporting requirements can range from simple ad hoc queries to frequently requested formats and tables at the same level of detail as in the warehouse. The warehouse needs to be integrated with common access tools which are consistent with the ability and the need of the decision makers. The more progressive tools should also provide the ability to pinpoint the distribution of data extracts and summaries to specific users. This is a boundary step of empowering end users to be cooperators of a data warehouse function.
Involving Others in the Organization
The process of managing data and the coordination of data processing functions require the involvement of numerous individuals. These individuals will often not be close working colleagues. Forming various groups to focus on data management issues will help leverage the contribution each can make. In some cases various groups may be combined.
Data Stewards Group. These are the individuals who deal with and manage data in standard functional operational bases. They need to identify current problems which exist in maintaining the integrity of the data. Information is shared about best practices for standardizing, documenting, and sharing information. They should propose standards for their local data elements and develop the requirements for data management tools, techniques, and procedures such as the data dictionary, data validation, data correction, and data integration. Finally, they should apply and test standards, tools, techniques, and procedures as they evolve and then make recommendations for changes as appropriate.
53
Administrators Group. These are the senior administrators who have the authority to make decisions across the various operational databases. They need to consider the problems they recognize in the delivery and use of data. They also address questions of conflicts such as, who is the custodian, what is the source of certain data elements, and who is responsible for official codes. They need to assist with the coordination of standardization activities across departments and system areas.
Information Systems Group. These are the managers of the information technology. This group should also include some of the major users and custodians. Here, individuals can investigate, refine, and develop automated data management tools and techniques such as the data dictionary, edit and validation routines, integrity audits, relational systems for decision support, and readily accessible documentation. It should also investigate and recommend appropriate platforms and strategies for distributing decision support information to university administrators and executives.
Management Information Group. This is a group of midlevel managers who are responsible for the day-to-day management of the organization, and who depend on the integrity of data. This group deals with access, timing, integrity checking, and other issues which impact the value of the data. These people set the objectives and tactics of the data management initiative on an annual basis. The group also identifies the planning needs for data. It reviews project plans and progress reports.
These managers review recommendations and products, and endorse action or adoption of standard procedures. Depending on the culture and courage of the institution, this group may even be authorized to make policy and define procedures.
Decision Support Group. This is a smaller group, which takes the recommendations of the management group and discusses strategy for implementation. It may be an office of an organizational unit the institution has designated to support the management of the data. In instances when the institution is not willing to make the commitment to coordinate the management of the data centrally, it may be made up of representatives from three or four key areas who meet periodically to review progress in their areas.
Operational System User Group. This group of individuals focuses on the use of a specific system. For example, there might be a student data users group. This group can vary in formality with functions ranging from authorizing code changes to sharing effective ways to develop reports using the data. Where there are users who have dependence across systems, forming a cross-functional group of administrative systems users may be beneficial. People who are working with the operational system and the functional data structure are key
54
members of this group. It is also helpful to have some of the technology individuals in this group.
Implementing the Broker Role
The data warehouse, discussed above, is the blending together of multiple tools with multiple needs of managers and coordinating related data management activities across the operational breath of the institution. This typically is not one of those "build it and they will come" endeavors. However, the numerous tradeoffs such as detail and capacity balanced against speed and expense are not simple to resolve. There are no easy answers. Mature negotiation and the bargaining skill of the broker, along with help from key managers and administrators, are required for selecting appropriate levels of aggregation, time-frame data maintenance in the active warehouse, involvement of managers, subject nature of the data structure, and policies requiring the proper processing of data. To accomplish this, an individual at the institution should be assigned the responsibilities identified in Table 3.
Table 3
Broker Responsibilities
|
Clarify needs: identify decisions and determine involvement of the administrative information infrastructure for administrative, academic, and external users; determine mutual needs for data and the associated timing of uses |
|
Document means: develop and disseminate means for obtaining, retaining, maintaining, explaining, analyzing, and exchanging information; use feasible technology; involve users; visit someone who has what you want |
|
Define content: coordinate development and refinement of various management data policies and procedures; relate to other operational processes; associate compliance with expectations and rewards |
|
Develop data: direct projects to enhance management data and administrative information support; check with users, look for bottleneck problems and root-cause problems; prototype improvement and demonstrate results |
|
Implement use: teach various users the skills to use institutional and external data; share alternative data sets; provide one-stop shopping for monitoring institutional success factors |
Implementing broker responsibilities will most likely change the way in which the institutional research function operates. In Table 4, specific duties are enumerated which will result in the implementation of the broker responsibilities.
Brokers need to have technical ability, managerial skills, and knowledge about the specific institution at which they are working. They will need to work closely with individuals in information resource management/information systems units, where the technical work to build the data warehouse and bridge it to legacy systems is typically done.
This is not a place to learn on the job because of the heavy interaction
55
Figure 4 Broker Duties
|
Support the continued improvement of the office ability to provide high quality service to various customers. |
|
Maintain a h h level of professional knowledge in hardware, software, an organizational l'.)rocesses related to the management of aata using information resources. |
|
Analyze institutional needs for improved data and information and integrating with other projects. |
|
Integrate the needs of administrators and managerial users with the availability of data and the capability of technology to produce improved data support. |
|
Develop concertual management models and define components of managemen data and administrative information. |
|
Manage the various projects and technical workgroups of professional faculty and staff. |
|
Learn, use, and teach various methodolo ies to improve the administrative process based on the ava1 ability of data. |
|
Develop and implement training pro ams for institutional personnel on the concepts and c a ilities of hardware and software related to management ata and administrative information. |
|
Pursue personal, professional and scholarly development including participation in a network of professionals at comparable institutions and serve in professional associations. |
|
Represent the office and, where appropriate, the institution at various system, state, and national activities, nejotiations, and presentations (NCES, ACE, NASULGC, AIR, A CC, etc.). |
with key administrators who have their own concerns. Further, people who support the development of the data warehouse must have a strong interest in continued scholarly growth to deal with the rapid development in the area.
The broker function must be the opportunistic application of organization vision to operational resource realities. The function depends greatly on the ability and willingness of the custodians to create data as an asset to the institution. Success depends on the central coordination of the data resource and the availability of some type of data warehouse. In addition to the warehouse, there needs to be extract tools, data handling tools, and relational database management systems.
The broker should also be involved in the Knowledge Management process of the institution and should conduct this process with the custodian and the manager. Such an activity can be either based on the codification of the activities and related events of the institution or it can
56
be based on providing a means for the members of the college to work with appropriate colleagues when issues and problems occur. (Hansen, Nohria, and Tierney, 2001)
Making the Broker Job a Success
We have outlined specific tasks that are expected to be performed by the Broker. Success in these tasks will require the development of an understanding of the decision making cycle at the institution and the relationship between key people and the decisions they make. Facilitate the focus of research questions by grouping customers with projects to take advantage of common issues and common responsibilities and common needs. Meet and involve subject matter experts (faculty) in areas of concern. Learn from them the biases of their assumptions and methodologies when problem solving. Continue professional development, by joining AIR, and/or other professional organizations that can contribute to personal competency. Finally, maintain an ethical and fair balance. Where a professional stands should be a function of where a professional sits, and this is respected.
The next step is to look at the integration of information into the institution's knowledge base. Users are managers who are interested in the flow of facts and the integration of facts with existing knowledge. This process, which extends knowledge and forms new intelligence around decision points, is discussed in the next chapter.
57
CHAPTERS
THE MANAGER-REALIZING VALUE FROM DATA
We need understanding businesses devoted to making information accessible and comprehensible; we need new ways of interpreting the data that increasingly directs our lives and new models for making it usable and understandable, for transforming it into information. We need to re-educate the people who generate information to improve its performance, and we, as consumers, must become more adroit as receivers ifwe are ever to recover from information anxiety. (Wurman, p. 50)
The manager is the person who receives information from the broker. He or she uses it to describe a situation, identify a problem, select and evaluate alternatives, make a decision, or defend and advocate previous decisions. Managers' actions integrate information into the institution's knowledge base, thereby reducing uncertainty and increasing "organizational intelligence." The organization, thus, "learns." Usually, the manager deals with uncertainty and makes decisions with less than perfect information.
What Does a Manager Do?
Managers must monitor and measure the value of information they receive and judiciously use it to add value to their existing knowledge base. The problems they solve must be important to the institution. As such, managers are in the best position to identify changes in business rules that must be reflected by the organization's data. They need to educate the supplier, or the data custodian, about the needs for data, and how the data are used. The custodian can then capture and store the most appropriate data. The manager must also know about the different types of tools and technologies that can be used to access data.
Whether an individual or several individuals establish the link between the data and the tools, it is critical that it be established. To accomplish these tasks, there are a number of specific responsibilities that must be accepted by the manager. These responsibilities are listed in Table 5.
In order to successfully meet these responsibilities, the manager must recognize threats to internal, external, and construct validity. These characteristics of quality decision-support data and information are critical. Data processes and analyses must be continuously monitored and tweaked to reflect the institution's business rules in line with validity concerns.
Internal Validity. Internal validity is the interpretability of the data: Is it what it seems? Was it collected about what you think, when you think, and how you think? The accuracy, reliability, and interoperability of the data define the internal validity of the data.
58
Table 5
Manager Responsibilities
|
The manager must ensure that the organization serves its basic purpose of producing specific goods or services. This implies that the manager understands the institution's purpose and can determine whether an organization is moving in that direction. |
|
The manager should create and sustain a level of organizational stability, which will be manageable. Excessive instability prevents effectiveness. |
|
The manager aligns strategic purposes with the resources of the organization. With a sense of a mission, the environment, the threats, the opportunities, and the alternatives, the manager needs to provide direction for the organization and focus change in a feasible way. |
|
The manager makes sure that the needs of the key stakeholders in the organization are met. For many of us, this is the State Legislature, taxpayers, students who pay the bills, faculty who determine governance issues, or some combination of these key influences. The key is to understand the interest of these diverse groups and integrate their concerns into a coherent strategy. |
|
The manager serves as a strategic informational link between the organization and its external constituents. As that link, the manager must defend the organization, advocate its positions, articulate its needs for resources, monitor external issues, and disseminate information to internal constituents. The flow of information is characterized as "continuous, real-time, and specific in its detail" and not as "long-term" or "big picture." |
|
The manager works within the formal authority system of the organization. The manager must delegate, appoint, and anoint the people responsible, and held accountable, for organizational activities. |
External Validity. External validity is the sufficiency, timeliness, and appropriateness of generalizing the data to a problem-it may include the characteristics of the situation under which the data were collected and the characteristics of the current situation.
Construct Validity. Construct validity is the relevance of the data to the issue - does it integrate with the existing knowledge base of the institution-increase intelligence and support next steps?
The manager needs to work with the custodian to enhance the reliability of the data. The manager needs to work with the broker to enhance the internal validity of the data. The manager then needs to work with the custodian and the broker to help them bring knowledge forward that is based on reliable data and interpretable information. The manager must share his/her needs based on the decision processes and needs of the institution.
59
Systems and Tools for Managers
The information the manager needs comes from different support systems, depending upon the need. These systems range from transaction processing in operational systems to sophisticated expert systems.
The Operational System. These data systems are the applications systems that support a particular function, such as accounting, payroll, etc. These are also often referred to as OLTP systems (Online Transaction Processing). They are designed to optimize online data entry and the processing of large numbers of transactions. These systems support institutional operations such as payroll and student registration.
The data change rapidly, and continually, always reflecting the most recent status of any given data element. OLTP systems provide answers to such questions as: What happened last? or What is John Doe's benefit status? The basic architecture of this system supports online updating, and rapid response to queries usually focusing on a particular transactional unit of information. A classic example of an OLTP system outside of higher education is an airline reservation system.
Management Information Systems. The system architecture that most readily supports management information is the data warehouse. Data are captured from the various operational systems, converted, cleaned up, integrated and standardized, aggregated, and summarized. The data warehouse contains historical data, in both detail and summary form. It is a collection of dated snapshots of data designed to support management decisions. The data, once loaded, is not updated. The data from the warehouse are used to answer questions such as: How has graduate student enrollment changed during the past 10 years? and How does the percentage of minorities in all departments, and colleges, in 1985 compare with that in 1995? The architecture of this system supports functions such as trend analyses. It is designed to support queries that access large amounts of information.
Performance Analysis Systems. These systems include decision support and executive information systems. They support many different types of analyses: trend analysis, what if, etc. "What revenue will be generated by increasing the out-of-state enrollment?" is the type of question investigated using performance analysis systems. The data warehouse provides the data that can then be further analyzed with performance analysis systems. Another term for many of these systems is Online Analytical Processing systems or OLAP and business intelligence (Bl) tools. The architecture for many of these systems is a multidimensional cube, set of cubes, or arrays. The ways the user wants to view the data (the dimensions) are defined, along with the elements the user wants to aggregate (the measures). The tools then build a model and create a structure that supports rapid access of the predefined data elements. With most of the products currently available, the data is aggregated and loaded into a multidimensional cube. The cube
60
architecture ensures rapid response. When the dimensions and measures are appropriately defined and packaged, the manager, or user, can perform analyses that range from basic statistical analyses, such as max, min, mean, and ranges to more complex analyses such as linear regression. The complexity of the analysis is dependent upon the capability of the OLAP product. All of these products allow the user to "explore" the data, and display the results in many different graphical views. The architecture of this system provides rapid access to information through a very user-friendly interface. This interface then feeds into various enterprise systems.
Tools for Information Access
There are several different types of tools that the manager can use to access data. These include:
Desktop Database Management Systems. With the use of a desktop DBMS and the ability to retrieve selected data in a standard database format, the manager will have maximum flexibility for manipulating data, migrating data to other desktop products, and producing reports.
Spreadsheets. Spreadsheets can be used to do data analysis and some reporting. They can even be used to create databases.
Word Processors. Reports and documentation can be accessed and viewed with word processors.
Web Browsers. The World Wide Web potentially provides an excellent platform for accessing meta-data, packaged data subsets, reports, etc. The Web provides platform independent access. This is an area that is just beginning to develop in terms of its potential for decision support. Many organizations are implementing "intranets" to provide their managers with both internal and external data and information.
OLAP Products. These products provide rapid access to data with Graphical User Interface (GUI). They provide standard analysis functions, and support drill-down/drill-up processes, point and click, drag and drop navigation, and exception highlighting. They complement the data warehouse.
Desktop Statistical Products. There are several desktop statistical products for providing analysis. Probably the best-known products are SAS, Minitab, and SPSS. There are also special purpose programs and programming languages for more complex needs.
Ad hoc Query and Data Browsers. There are several easy to use products which provide users with access to data in relational databases. They support ad hoc query, so the user can construct and execute a simple request using an English-like language. Most of these will provide the user with a formatted report or the option to save data in a format
61
which can be used by a spreadsheet, a desktop database, or a desktop word processor. These tools greatly enhance the utility of the data warehouse.
Institutional Research Support for the Manager Role
The information-transmitting function is crucial to organizational decision making, for it almost always involves acts of selection or 'filtering' by the information source...Hence, the subordinate acts as an information filter and in this way secures a large influence over the decisions the superior can and does reach. (Simon, p. 284)
The manager is the nerve center of the organization. He or she continually seeks and receives information from numerous sources and must reconcile the information with organizational needs. The manager uses the data to test the validity of a perception against the reality of the situation. The manager detects changes, identifies problems and opportunities, understands the options, makes decisions, and provides key stakeholders with an understanding of both the problem, and the solution (Mintzberg, 1973). The manager's performance depends upon proper analyses, which will restructure and summarize data into the most usable form. Institutional research often functions as an integrator and transmitter of the data.
While institutional researchers do not typically see themselves as filters and integrators, these may well be their most influential role. The typical institutional research mission is to enhance institutional effectiveness by providing information which supports and strengthens operations management, decision making, and planning processes of the executive administration. These activities include:
1. Performing studies that describe, analyze, and interpret the policies, functions and activities of the institution for the executive-level management (the President, the Provost, the Executive Vice President, etc.)
2. Supporting the development of management information capabilities throughout the institution.
3. Providing consistent and reliable statistical summaries of selected university-wide data and coordinating Integrated Postsecondary Educational Data System (IPEDS) and similar external reporting for the college or university.
4. Supporting the standardization of institutional administrative data codes and documentation.
5. Providing a credible ethical source of information. Making all data and information available within the constraints of confidentiality, remaining sensitive to the gray area between slanting data, and supporting the institution's decisions.
6. Training users in basic data collection and data analysis skills.
62
The services implied in this mission focus on bringing together data, integrating much of them with qualitative factors, reducing the complexity of the facts, and bringing them to the attention of the manager. The skill set needed to provide the services (listed below) is an obvious demonstration of the institutional researcher's interest in all aspects of institutional data management.
• Problem Identification involves identifying problem areas where decisions need to be made, searching for the broadest range of situations, and considering alternatives and their feasibility. Alternatives might include forecasting studies, market research studies, and anticipating gaps in strategies.
• Cost-Benefit Analysis involves the detailed consideration of the resources required for specific strategies and evaluation of these resources in light of the outcomes from these strategies. Outcomes assessment is an example of cost-benefit analyses.
• Model Building is the process of simulating complex events with either simulation or mathematical equations which, when taken together, will anticipate an outcome caused by a complex set of events.
• Contingency Planning comes from developing strategies for dealing with undesirable events and is designed to reduce the negative impact of those undesirable events.
• Real-time Analysis is the use of an analytical methodology "on-the-fly" to look at the desirability of alternatives, as they become apparent.
• Project Monitoring is using resource flows, monitoring activities, and comparative analyses to help keep a project on time and on target.
• Adaptive Planning is the process of building plans which can be modified to anticipate and profit from changing issues in a dynamic situation. These plans have multiple strategies and build multiple accomplishments into a tactic (Mintzberg, 1973).
While this list above is not exhaustive, it does demonstrate that information needs require the ability to use basic analytical tools in more complex combinations, especially when the emphasis is on the context and the use of the results.
Supporting the Manager Role
The data must be used in order to have value in the organization. The function of use and influence is different from the other functions in the Information Support Circle in that executing this function is mostly beyond the control of the person involved with the management of the
63
data. The role of the integrator becomes one of exercising indirect influence. This requires understanding barriers and unobtrusively attempting to overcome each barrier.
The barriers experienced in the use and influence of the data typically include a lack of interest from senior administrators and a lack of cooperation from contacts in offices supplying the data, the lack of consistent formats, and the possible sensitivity of the data, particularly if trends are moving in an embarrassing direction. How can the institutional research function help overcome these barriers?
Influence can be greatly increased by institutional awareness of the organization, its culture, and its context. This does not come from the facts or their direct use in a situation, but rather from the means by which situations are chosen and restructured to increase knowledge.
Institutional research can cultivate knowledge by helping users place the facts into an organizational context, i.e., the institution's culture, values, and goals.
Some examples of institutional research activities, which can increase the influence of facts through the contextual knowledge of their use, include:
• Increasing the visibility of the use of the data and information through examples
• Demonstrating the professional virtue of the information source by being credible, demonstrating integrity, and remaining silent until appropriate
• Obtaining the strategic support of people who can use the results
• Focusing the results of research on professional commitments and concerns of powerful individuals
• Leveraging mutual support and concerns of various groups by looking for conceptual models which provide an overlap of concerns-in other words, form coalitions around the information
• Strengthening functional authority by training others
• Influencing the management of data and information through the ability to work with the data and tools, applying these skills appropriately to specific situations
• Coordinating data, computers, and individuals interested in the results
• Using the technical tools available to access and analyze the data
64
• Providing credibility through secure, accurate, and stable information
• Using techniques to reduce great volumes of data into a structure which can be digested by the decision maker
• Providing insight about the data and the decision process
• Generalizing the results into a use, which is sufficient to cover the problem and is for the most part related to the problem or issue at hand
• Suggesting specific measures to consider
Other proactive strategies for overcoming barriers include:
• Creating user interest in improving their skills through training, positioning the information at the appropriate time and place in the organization, enabling other individuals in the college to do more of their own research
• Limiting information to the key issues in the situation
• Having information available just before it is needed
While institutional research functions and offices typically possess considerable technical skills and are usually eager to extend these skills, their mission, skill-sets and expertise typically revolve around research and analytical processing. The use of internal administrative data for trend, comparative, and predictive analyses, and in reporting depends on a standardized support environment where regularly scheduled data extracts are taken from principal transactional databases, integrated as a "warehouse" of data and with external data where appropriate. These data are accessed with software that supports merging, retrieval, analysis, interpretation, and reporting functions. From department-to department, criteria can be modified to meet specific needs of users.
As data and analysis tools are more widely available to a variety of internal and external users, institutional research functions will continue to evolve both as a major user of administrative systems data and as an information broker, providing integrated data and training in analytical processing to users. The speed of this evolution and the quality of support will depend on the value of the data. This, in turn, depends, not only on the commitment of the institution to support organizational changes necessary for data management, but also depends upon the quality of the technical resources available for its data management.
Making the Manager Job a Success
To accomplish the tasks outlined above, we offer the following as a foundation for success. Read The Fifth Discipline and other books about the learning organization. Avoid gimmicks or books with "minute" or
65
"secrets" in the title. Get out and meet people who are important to the successful operation of the data management process. This includes senior administrators as well as others doing the work. Develop a vision of where the organization is going, what needs to be done to get there, what the limits are for feasible solutions, when decisions have to be made, and what problems seem to exist. Begin studies, group projects, and tasks to identify what information is needed, within what time frames and at what cost. Finally, visit other managers who are successful, and share what is found by joining professional organizations of such managers in areas as Society for College and University Planning (SCUP), National Association of College and University Business Officers (NACUBO), American Association of Collegiate Registrars and Admissions Officers (AACRAO), etc.
CHAPTER 7
GETTING STARTED: JUST DO IT
An Irish Prayer
May those who love us, love us, And those that don't love us, May God turn their hearts.
And if He doesn't turn their hearts, May he turn their ankles,
So we'll know them by their limp.
(AIR Newsletter, Sept. 14, 1992, Original source lost in antiquity)
Colleges and universities are complex adaptive systems. They consist of departments, offices, and managers who should be continually striving to adapt to a rapidly changing and uncertain environment. These managers and their staffs need data and information to reduce uncertainty. This helps them to explore, clarify, and define strategies and tactics. Complex adaptive systems will be successful if there are large numbers of individuals with a similar purpose, with usable mechanisms for learning, and a source of energy to create activity.
In the preceding chapters, the management of quality data and information is defined as a complex process. The data custodian, the broker, and the manager need to work together to transform data into information, and use that information or organizational intelligence to define and solve current problems and anticipate future challenges.
Managing Data for Information
Learning about the management of data requires more than a set of technical skills and abilities. Management of data requires an understanding of the organizational processes of the institution, and an understanding of the environment in which the data are both produced and used. Dealing with this complexity and establishing value-added niches requires an understanding of the general organizational process of adaptation. What are the basic strategies and tactics required to change the organization? What are the issues involved in the change, and what are the lessons we have learned from working to change and improve the management of data?
Properties of Successful Information Support
Two key characteristics or properties were discussed in Chapter 2, which are necessary for the successful transformation of data into useful information and increased organizational intelligence. These properties are dependency and cooperation. Here, we develop the discussion of these properties in the context of the Information Support Circle.
67
Dependency
As we have seen, each function in the Information Support Circle (Figure 2) is dependent upon the previous function. This dependency provides the basis for focusing our efforts on the best strategy for increasing the value of data to the institution. The quality of each function is limited by the quality of the preceding function. The foundation for this premise is basic measurement theory. If a measure has no reliability, it can have no validity. The value of using the results of measurement (e.g., information) is limited by the ability to replicate results. Nonetheless, the functions of the Information Support Circle have limitations, which are discussed below.
• The ability to identify the problem and measure the proper factors (content validity) is limited by the ability to deal with the problems in a systematic and relevant fashion (Use and Influence Knowledge).
• The value from collecting and storing a valuable data asset (reliability) is limited by a lack of understanding of the importance of the various issues (Identify and Measure Concepts).
• The value obtained from restructuring and analyzing the data is to understand what is happening (internal validity) and is limited by an ability to obtain data which is consistent and stable (Collect and Store Data).
• The value of information delivered and included in reporting to generalize the results (external validity) is limited by the ability to interpret what was done in the analysis and by the understanding of causality (Restructure and Analyze Facts).
• The value from the use of the information to influence the situation (construct validity) is limited by the ability to generalize the information to the situation of concern (Deliver and Report Information).
The key to improvement is the ability to recognize and learn from these limitations. If the quality of a function in the Information Support Circle is limited by the quality of the preceding function, then the only way to improve that function is by improving the preceding function.
Improvement for the entire support process is limited by the quality of the weakest function (the weakest link). This conclusion is consistent with the conclusions of those who look at root-cause analysis. Correcting problems, which are not the root cause, will not produce major improvement. Improving the analysis of the data will not overcome the lack of reliable data. Improving the quality of data will not increase the value of information support, if the decision makers do not properly
68
identify measures that reflect the issues. Developing standardized data when the lack of standardization is the root problem will improve the value of all other functions.
Cooperation
Cooperation among the manager, the broker, and the data custodian is critically important. The vision of the executive needs to be shared with the entire organization. Data custodians must share the experiences they have working with the institutional activities, and the measurement of those activities. The brokers must work with both groups to analyze and restructure the data. Instilling and encouraging cooperation may be the most challenging aspect of improving data management. It requires someone, a champion, who will motivate, and facilitate conflict resolution. It further requires a shared commitment to the institution's vision, a sense of how the institution needs to change.
Finally, it requires an understanding of the way people react to change. Cooperation can overcome the problematic situation that results when the manager makes a request of the broker who in turn makes a request of the custodian. The custodian collects the data, gives them to the broker, who then analyzes them and shares the results with the manager. Very often each of the players in this chain of events becomes frustrated as they attempt to respond in a vacuum without the benefit of systematic thinking or the culture of cooperation. On the other hand, if players are cooperating, there is one central conversation rather than four linear conversations, and work can potentially be done in parallel, rather than sequentially, leading to faster and better solutions to problems.
Managing Change Processes: Basic Models
It has been said, "nothing changes if nothing changes." Improvement requires change and change requires effort. In order to sustain and nurture a change effort, you must have a personal understanding of the change process, and the impact it has upon others. Following are three models for understanding the way change occurs and the way people react to change. These three models relate, in sequence, to activities performed by individuals working in groups. Of course, there are many other models, and as you work with change, you may develop your own. As illustrated in Figure 11, the three change models come together at certain points as change occurs across the campus.
The first model frames the change process for activities in terms of the Plan-Do-Check-Act continuous improvement cycle. During the Plan stage, we collect viewpoints, and based upon these viewpoints, determine problem areas, scope, possible causes, and alternative solutions. During the Do stage, prototyped solutions are developed, and the results measured. This is the stage where change begins to occur. In the Check stage, the results of the prototype are evaluated in respect to anticipated results, or against a baseline, to determine the impact of the change. In the Act stage, the change is integrated into organizational processes, and the improvement change cycle begins again.
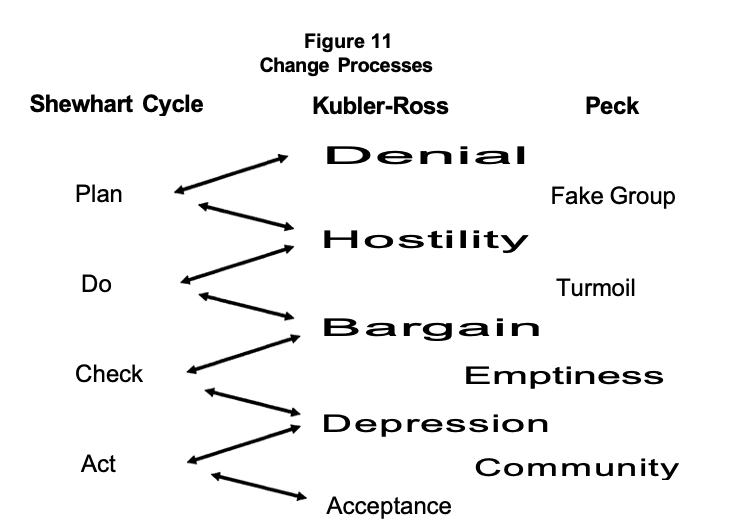
The second model is the individuals response to change, illustrated by the Kubler-Ross (1974) sequence for grieving, i.e. denial, hostility, bargaining, depression, and acceptance. It recognizes that change is first and foremost, the loss of the way "we have always done it" and this loss is always traumatic, as comfort zones are threatened. As the Plan emerges, there is disbelief (denial) that a problem exists. During the next phase, the Do stage, there is a reaction to the change (hostility). During the Check stage, invariably bargaining is attempted. There is the stated desire by those involved to make the best possible change, which too often turns out to be the least amount of change. When finally there is a realization that real change is inevitable, people are often overwhelmed (depressed). As they begin to learn the new process, and, particularly, if they have some influence, depression is replaced with acceptance, during the Act stage. As improvement becomes obvious, individuals not only accept the change but also take personal pride in improvement.
The third model provides an understanding of group response to
change. F. Scott Peck, in The Different Drummer - Community Making and Peace, discusses four stages that a group goes through before it operates as a team, with a commitment to improvement or a true "community." These stages are pseudo-community, chaos, emptiness, and, finally, community. During the development of a new central mission or purpose, the group will first act as though it is already working together, operating as a true team. This is pseudo-community or false community. The group is not working together, but feels it can avoid change if it "gets along" and avoids differences, conflicts, and confrontations.
Because conflict is inevitable, the group will eventually move into the chaotic phase. Conflict surfaces as individuals experience and express
70
hostility toward those members proposing new and different ways of doing things. There will be well-intentioned attempts to obliterate differences by offering simple cures, and bargaining will ensue. During the third phase, the group admits there are new options, and they experience emptiness as they begin to let go of the old and seek out the new. Feelings of depression accompany the realization that change is required. In the final phase, the individuals become a true functioning group or community with an acceptance of new ways of doing things.
They, the group and individually, gain energy from the shared experience
of confronting issues and finding solutions.
These change models are not principles of individual or group behavior, but do seem to reflect the way many of us respond to change. They are important to consider, since they clearly indicate that change and improvement are difficult, and that significant amounts of resolve and patience are needed to undergo real change and thereby improve.
We can speed the naturally occurring stages in the change process by employing five strategies (Geller, 1989) that will ease the impact:
Awareness and Education. People must be given sound reasons for change. This will improve the acceptance of change. Awareness and education seem to best occur in small groups and include interactive demonstrations and discussions.
Verbal and Written Messages. Messages can be effective. There are appropriate times to use verbal messages and appropriate times to use written messages. Both types of communication must be concise and easy to understand.
Modeling and Demonstrations. Modeling is a way of prototyping a process or change and documenting the anticipated results. It can help people think through the process and anticipate outcomes.
Commitment and Goal Setting. Individuals must participate in goal setting. If the goal setting process is accomplished with both individual and group participation, it can enhance commitment to the goals and buy-in by individuals to the process.
Engineering and Design Strategies. An organization must be structured to support change. It is critical that procedures and policies make the change easier. The reporting structure {management structure) of the organization can also either facilitate or impede change. The structure, policies, etc., that will support change ideally will be in place before you begin as structure must follow strategy.
The Culture of Change
There are several cultural indicators we should observe during transition that can alert us to areas that might require particular attention. These indicators can also help us assess whether we have truly evolved to a "change and improve" culture, or case-in-point, to a new data management culture.
71
• Do people openly acknowledge and value working relationships with individuals across the organization?
• Do people claim ownership for problems as opposed to blaming others or the system?
• Do people accept working with others at levels above and below them within the organization's hierarchy?
• Are people willing to take risks and embark on new ventures?
• Are people receptive to others, seeking input, and considering a variety of perspectives?
• Do people who represent different interest groups make an effort to make contact and communicate with each other?
To the extent that we can answer "yes" to each of these questions, we are well-positioned to evolve a data management culture that indeed embraces "new ideas for new challenges." We must remember that change is a process and that changes in attitude, however subtle, signal progress. These include shifts from managing to leading, from control to coaching, from quantity to quality, from opinion to information, from resistant to change to open to change, from people as commodities to people as resources, from suspicion to trust, from compliance to commitment, from internal focus to customer focus, from individual to team, and from detection to prevention (Plice, 1992). All of these transitions are part of growing a data management culture. It is important to watch for these transitions and recognize them as gains in terms of awareness and commitment. They signal emerging pockets of support. Data management can no longer be regarded as a technical issue.
There will need to be changes in our organizations. Matrix organizations and cross-functional teams focused on specific tasks or problems must become commonplace. This places the data users and people who need information in direct contact with the data suppliers. Anyone who produces data and information for decision making must shift from the data analyst role to the role of facilitator and broker.
The organization which tries to distribute information without management processes to define and document data will fail. The organization which does not push out the data and transform it into information will fall behind more progressive competitors. The organization which does not restructure to support a revised decision structure will frustrate its employees who will, in turn, waste valuable time and energy on feudal turf battles. The organization, which does not continually train its employees to manage and use information, will make questionable decisions.
We must step forward and nurture a data management culture. Deal and Kennedy suggest we must resist the temptation to roll up our sleeves and wade directly into the resolution of the problem as traditional managers if we truly want to encourage lasting change or transformation to a new culture. They suggest as an alternative the notion of a "symbolic
72
manager" who recognizes that the solution is to rely on individuals in the culture to meander their way to a solution.
"New ideas for new challenges" amounts to creating a web of intelligence from the ideas and vision we have today. The web of intelligence is the new data management culture. It must be anchored by educated, empowered people who perform relevant and timely activities using sophisticated navigational and analytical tools on properly integrated quality data from both internal and external sources.
Strategies and Tactics
The ultimate measure of success for creating a management information infrastructure is the extent data are used in decision making. It is only when executives begin to reference data/information in decision making that the best intelligence will be applied to the challenges they face. There are several strategies and tactics that can be used to help individuals who have been inspired by this book to create and establish a management information infrastructure. It is absolutely critical that the linkage between the data and the need for information is established.
Below are some specific steps you can take to establish this linkage in your own organization.
• Market the value of the information, and the benefits of having information in order to understand issues. The entire process of creating a data management culture and management information infrastructure is extremely complicated, and it is very easy for people to loose sight of the tangible benefits. Throughout the process, you must present the need in terms that managers can understand.
• Identify areas where quality data are critically needed and are especially inadequate. One of these areas may be an appropriate area to prototype. Picking a visible area to prototype will help demonstrate the potential of the project and also gain support for the project.
• Obtain and train the best people to work on the information. The project requires many different skills. Train people in project management, processes, and technology.
• Attract resource support by helping to diagnose problems. This relates to developing a prototype. If you can solve a problem for someone, they will be likely to help you obtain the resource support you need.
• Adjust the ends to fit the means. With an undertaking that is this complex, it is easy to overreach. Make sure you keep the end in sight. Then break the project into manageable phases and celebrate iterative successes. This will help sustain the interest and motivation of all concerned.
73
• Do not set impossible goals. Again, with an undertaking as large as this, it is easy to define goals that are not reasonable. This undermines the entire project, and is a way to ensure failure. Set achievable goals and identify reachable milestones. Measure and communicate the progress you make. When possible, identify multiple strategies to achieve your goals.
• Define and redefine plans and progress. This requires breaking the project into phases. Define the first phase as your stage-setting accomplishments, the current phase in detail, and third phase in concept. When you complete a phase, define the next one in detail, adjusting to include what you have learned, and what you can do to improve. Never lose sight of the overall information infrastructure you are striving to create.
Lessons Learned
The organizations that will truly excel in the future will be the organizations that discover how to tap people's commitment and capacity to learn at all levels of the organization. (Senge quoted in Merlyn, p. 40)
As you move your institution into more systematic data management, you become increasingly aware of the people processes that influence the success of what you do and the types of issues you face. There is no guarantee that the issues you face will be the same as those which others have faced, but we believe that lessons our colleagues and we have learned can be shared with positive effects. It is in that spirit that the following are shared.
• Some non-performers will begin to perform as they are motivated by recognition of their unique expertise, opportunities to take on different tasks in the more fluid organization, and challenged to think creatively and take risks.
• Anyone unwilling or unable to deal with change may leave or relocate within the organization when their worn rhetoric and claims that "this is the way we have always done it" are challenged and/or ignored.
• New leaders will emerge who are flexible, who are committed and determined, who nurture growth and learning, and who communicate a vision for the future.
• Roles will swap with some non-technicians moving into more technical endeavors and some technicians taking on managerial responsibilities.
74
• Understanding that all change is a step-by-step process can ease the trauma. When we clarify where we are in relation to where we have been and where we are going, we are less fearful and, therefore, willing to step out of the comfort zone of the familiar and participate in transformation.
• Training is essential to survive. People want to work smarter and deliver a valued product. To do this, they need to constantly upgrade their skill-set. This happens only when someone in the organization understands that the future of the organization rests with people, not technological tools, and is, therefore, willing to invest accordingly.
• The institutional research function must be involved in a complement of training, covering everything from new technology tools, project management, and working in teams, to the way the mission and purpose of the institution is changing. Knowledge builds confidence and confident people will step out, deal with change, and work for continuous improvement.
• It is important to have a recognized organizational function directly involved with managing the distribution of data to the users. Someone should feel that his or her salary is directly based on the success of the data management strategy. This function must coordinate data management at all levels of the organization and assist users with the resulting products. It may also be responsible for the more traditional data administration functions of custodian support, standards administration, and information systems planning. Another strategy is to provide a technical support bridge between users and the computer technology function.
• The new organization should not become involved in managing technology. It should remain attentive to managing data and information and, as such, may logically affiliate with any one of several existing central university functions depending largely on where users currently seek and find answers to their information requests.
• The enemy of continual gradual improvement is burnout. To avoid burnout, celebrate incremental victories. It is also helpful if workgroups initiate communication about expectations and personal goals and then work toward mutually beneficial outcomes. Always take time to assess progress and help others understand that every improvement is a success.
75
In Conclusion
As stated in the Foreword, this monograph represents a work-in progress. Technology is constantly changing and making new things possible. Meanwhile, the rightsizing/downsizing or simply restructuring organizational structures, processes, and resources places additional pressures on people trying to lead change. Perhaps the greatest unmet challenges rest in the measurement and communication of our progress in ways that facilitate the integration of judgment and intelligence. While we have changed and grown, we know there is much more change and growth ahead. Our choices are limited: lead, follow, or get out of the way!
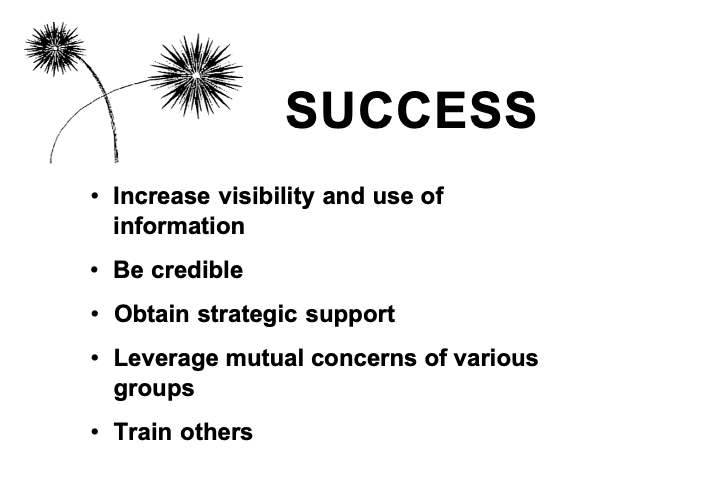
APPENDIX I INFORMATION SUPPORT AUDIT
The improvement of the information support will be best accomplished by starting with a realistic idea of how well the existing process supports the needs of your institution or organization. In order to assist in this evaluation, we have prepared a set of 100 items, which look at the quality of the various functions involved in supporting information.
For each item, consider if it represents the situation with which you are familiar. If so, circle the item number. At the end of the set of items, add up the number of circled items. The best place for your efforts is with the function in which the lowest number of items is circled.
Identify and Measure Concepts
1. A clear understanding of explicitly stated purposes and goals for various major programs and units exists across the institution.
2. A flow chart of the relationship of various data systems (and information) and decisions has been developed (as in Information Architecture).
3. Individuals are given responsibilities and authorities for specific objectives.
4. Executives welcome questions about strategic issues and key stakeholders.
5. Technicians and analysts are involved in goal setting at all levels of the institution.
6. Everyone understands the management processes used in the institution and the institutional research office.
7. There is consensus about what variables are important to describe specific situations and events.
8. Important (if not all) issues are measured with objective facts.
9. Believable and accepted models have been developed to explain anticipated outcomes.
10. Most user questions can be answered from census-date databases or an institutional fact book.
11. Standard definitions exist across the institution for key concepts such as faculty, student, and department.
12. Variables or measures exist which when monitored indicate the success or failure of activities.
77
13. Measures include indicators of what the institution considers important.
14. Processes are considered multidimensional {happen over time, have sequential functions, involve multiple personnel, etc.) and are integrated with participants' beliefs.
15. External events are associated with internal activities.
16. Success in key areas can be monitored or recognized by observable events.
17. Decision making is considered by most campus officials to be part of a logical decision making process.
18. Variables are selected after reviewing literature, looking at previous institutional studies, and discussions with knowledgeable individuals.
19. There are visible relationships between goals, decisions, and rewards.
20. Offices and departments can describe their key success factors.
Collect and Store Data
1. Data element descriptions exist with enforced standards and extracted point-in-time census date databases.
2. There is a list of the various entities which are described in the databases.
3. For each entity, there is a master list of attributes to include at least the long name, short name, abbreviation, code/ID number, and database location.
4. For each attribute, in the definition, there is a short description, standard name, source, storage location, allowable categories, type of element, length and type of field, date last updated, responsible individual (custodian), reference and reporting requirements, valid values and edit checks, and archiving requirements.
5. There are extract databases for managerial and strategic use along with operational databases for functional activities.
6. The access process is documented for each element.
7. The information about information is accessible and understandable.
8. There are standard procedures for extracting, editing, auditing, merging, and altering data.
78
9. The data systems are useful for various groups of individuals; both strategic and operational users.
10. Databases are flexible and usable in various environments and they are simple and easy to use.
11. A data element dictionary is readily available to data analysts and data users.
12. Responsibility for data is assigned to key administrators (custodians) who are evaluated on their support of this responsibility.
13. Data are captured as near to the source point as possible and audited for allowable codes as it is entered.
14. Administrative Systems and Services Group(s) coordinate databases and user needs.
15. Relevant data elements are extracted from the operating systems, integrated and put into a census file.
16. Data from various multiple academic periods can be merged into a single file.
17. "Should be" data elements are reviewed for possible change.
18. Read/write security is consistent with managerial responsibility.
19. Requests for new systems and computers require compatibility with local standards.
20. The policy for managing data exists and has been revised in the last two years.
Restructure and Analyze Facts
1. Flow charting the information process exists and reflects the flow chart of the decision process.
2. Written procedures for restructuring and recoding data are available to analysts.
3. There is a set of procedures/standards for extracting and merging data from databases inside AND outside the institutional research office.
4. Data flows and analyses are audited and corrections are documented.
5. Definitions exist for complex concepts based on combinations of basic data values.
79
6. People who analyze the data are trained in and use standard packages. Advisory groups of faculty are formed for specific projects of a technical nature.
7. User groups exist and contain users, analysts, and technicians for major databases.
8. Measures are interpretable and users understand what the codes really mean.
9. Procedures used to summarize and synthesize data are understood and results can be interpreted.
10. The sequences of events in the physical process represented by the data are documented.
11. Some of the information users are ex-analysts.
12. People who analyze the data have a personal knowledge of the processes by which the data are captured.
13. After the initial capture of the data, only value-added transactions occur.
14. Administrators have analytic perspectives and computer confidence.
15. Users can integrate distributed census-date databases using office technology.
16. Analyses use multiple measures and where possible adjust for various conditions, which occur while the students are enrolled, such as changing the institutional calendar.
17. Combinations of methods are used to look at the results from several perspectives.
18. The data are analyzed with a focus on the concerns and the capabilities of the users.
19. Where possible, definitions are used which are consistent with external reports.
20. Graphic and descriptive methods are used effectively and can be replicated.
80
Deliver and Report Information
1. Systematic procedures are used to identify people for whom the information is appropriate and authorized.
2. The delivery systems and documentation is at the level of the users' ability.
3. Data are in systems or warehouses where statistics can be computed in an easy manner.
4. State, federal, and local reporting is ongoing, somewhat automated, and refined as an ongoing process.
5. Reporting encourages dealing with real problems and not working just to find fault or "improving" the numbers.
6. The degree to which the results can be generalized to various groups is determined as part of the process and explained in available documentation.
7. Results of studies are integrated into the standard information systems of the college.
8. Processes and information flows are used to implicitly or explicitly manage the relationships with key stakeholders.
9. Results of studies and various key data are distributed to the various committees of the college.
10. Strategies are used to disseminate the information in a manner consistent with the need.
11. Standard graphic and analysis packages are used and are generally available.
12. A calendar of key decision dates is available to technicians and reviewed periodically.
13. Periodic reports are in a standard format.
14. Reports tell users the extent to which results can be generalized.
15. There are centrally coordinated standard networks, e-mail, and data handling tools.
16. Reports from various groups on the same topics have the same numbers.
81
17. Results are not heavily influenced by the methodology or measures used to obtain them.
18. Results support ability to attribute outcomes to specific causes.
19. Results of analyses reflect reality and generalize to other groups and future situations.
20. There are resources on campus for anyone who wants to learn to use the information system.
Use and Influence Knowledge
1. Members of the faculty use the information system.
2. Users see the information as unbiased and reputable, analysts are considered ethical.
3. Special requests are grouped into a periodic report and decisions are moved from unstructured to structured decisions.
4. Key administrators often meet with people who provide the data and conduct the analyses.
5. Vice Presidents and the President make frequent use of the information.
6. Information providers include people who share the values of higher education and who understand the management of the college or university.
7. Rational decision making procedures are used and based on data, ideas, and personal experiences.
8. Unanswered questions are part of every decision.
9. There are systematic reviews of information adequacy after major events.
10. Users come looking for late reports.
11. Problems are solved as part of a joint learning process, not as responses to unconnected emergencies.
12. Linkage and dialogue are established among the suppliers, producers, and users of assessment results.
13. Opportunities are provided for meaningful interaction among those who develop, manage, and use institutional databases so that there are numerous opportunities to detect and correct system errors.
82
14. Appropriate evaluation activities are identified at the institutional and department/program levels; responsibilities at each level are assigned to provide adequate support.
15. There are established priorities that insure existing databases are developed.
16. Information is organized around issues or problems that the institution is committed to addressing.
17. Findings are summarized so that the "bottom line" is easily reached by people who are less than enamored with the detail required by scientific methodology.
18. Adequate information is available to support decision making before the opportunity to decide has passed.
19. Baseline data are established and targets are set so that expectations of results are realistic.
20. A routine mechanism is developed for reviewing results and recommending use.
Summary:
|
Function |
lden/Mea |
Col/Star |
Restr/An |
Deliv/Rep |
Use/Intl |
Total |
|
Score |
|
|
|
|
|
|
83
APPENDIX II
MAKING DATAAVAILABLE
TO THOSE WHO NEED IT TO DO THEIR JOB*
Ernie Payne University of Arizona
The following is about making data available to "those who need it to do their job." The author's perspective comes from an institution that constructed its first data warehouse in 1990. The data warehouse for operational data was initiated in 1990, the reporting data warehouse in 1992, and the first version of the Web front end in 1994. Not everything was done the way the experts say to do it. If we had known then what we know now we would have done some things differently but still would not have done everything the way the experts say to do it. We have chosen the familiar "who,'' "what," "where," "when," and "how" approach to grouping our thoughts.
Who should have access to the data you are providing?
Data should be available to "the people decision makers turn to for information." All parties to the conversations need access to the same data. The conversations between decision makers can better focus on the issues when all parties are looking at the same data. The data can only be the same if it is recorded at exactly the same time using exactly the same rules and exactly the same implementation of the rules. Record and store data once and share data with all who need it.
The consumer base is not limited to the institutional research (IR) office. The list of people who directly retrieve data from the data warehouse at the University of Arizona (UofA) includes administrators, deans, associate and assistant deans, department heads, administrative assistants, business managers, advisors, auditors, analysts in the operational system units, and analysts in the administrative, college, and departmental information technology (IT) support offices.
Some decision makers retrieve data directly and some depend on
others to do it for them. Those retrieving data directly have an advantage over those who depend on others - the opportunity to explore, discover, and create information using their knowledge and instincts regarding the issue at hand. Questions are rarely framed as succinctly as they need to be at the beginning. Refinement usually results from interaction with the data.
*The authors want to recognize the contributions of Chris Janton. Chris Janton is a senior partner with Centos Prime (a consultancy). He has 35 years of experience in computing in higher education and industry spanning large data center operations, systems, large databases and data warehousing. Most recently (the past 12 years) he was the principal architect and project lead for the University of Arizona's University Information System (UIS - a hybrid operational data store and data warehouse).
84
There is a direct relationship between the number of people in the data access chain and the length of time it takes to refine the question and get an acceptable answer. The more people in the chain the longer it takes to match data to the question. Think about the old telephone game where people gather in a circle and relay a message by whispering from one person to the next. When the message gets back to the source it frequently bears little resemblance to the initial message. Strive to serve data to the person with the question.
A good way to enhance senior administrator interest in direct retrieval of data has been to provide them access during recruitment. Final candidates for dean recruitments were given Web access to institutional data. Most successful candidates have continued their use of the Web front end to directly access data to support planning and management of their colleges.
Some will say shortening the distance between the origin of the question and access to the data will not work because the person with the question does not understand the data. We contend that misunderstanding occurs in both directions. It is just as likely that the person who thinks they understand the data does not understand the question.
What data do you want to serve?
You want to start serving data as quickly as possible. Start with the data you have been using for "official" or "required" reporting. These data are often referred to as "census data." If you are in an IR office then it is likely that you have data on personnel, students, facilities, and expenditures. It is also likely that you have comparable sets of data across multiple years.
One set of data provides a data point. Two sets will let us draw a straight line. Three sets will let us draw a rudimentary curve. Four or more sets will start to provide meaningful context. Your consumers will want as many data sets as you can provide.
The data sets need to be created at consistent times each year to be valuable for context or across time comparisons. For example, initially we snapshot personnel data twice a year at approximately the end of the first and third quarters of the fiscal year, with the most important snapshot taken at the end of the first quarter, as these data are used for most external reporting. People at the University of Arizona get paid every two weeks. In the earlier years we would select the payroll run closest to the first of October. That would result in some snapshots taken after October 1 and some taken before October 1. Bad idea! Snapshots taken too early missed some faculty that were on academic as opposed to fiscal appointments, we missed some people hired to help with increased fall teaching loads, and we missed people hired at the start of the Federal fiscal year. Experience taught us to change the date of the snapshot to the first payroll run after October 1 each year.
The census data should be sorted into at least four categories; data which everybody can see, data which some people can see, data which
85
nobody should see, and data which do not belong in the warehouse. If the data relates to a specific person then it is likely that there will be restrictions on who can see it. This is especially true for data pertaining to individual students.
Data that everybody can see are typified by the data that appear in "Frequently Asked Questions" brochures and the "Fact Book." These are data that have been summarized to the institution, college, departmental, or program level and typically reflect the official statistics for the institution.
Data that only some people should see usually include data pertaining to specific individuals. Frequently these people consist of administrators, deans, and advisors. Administrators might want to see current and historical salary information about specific faculty or staff. Advisors often want detailed academic information on specific students enrolled in specific programs.
An example of data that should not be seen in the warehouse might exist in a data set in which the combination of social security number and employee or student ID is presented. While the translation might normally be handled by a "trusted application" available to individuals who need to translate from one identifier to another to do their job, this combination of data should not be available to the general public or most decision makers on campus. Data or combinations of data, which by law or institutional policy that are confidential, should not be made available through the warehouse.
Decisions on what data to offer once census data are available might be guided by input from consumers after they have had the opportunity to experience initial offerings. A good place to start is with associate and assistant deans or their equivalent. They generally are party to many important questions that need to be answered and are frequently involved in the process to get the answers. Talk to these people and ask them what questions they are often asked. Then, offer to trade answers for questions. It is the questions that should inform decisions on what data to make available.
Watch out for "bad data" accusations. Data are perceived to be "bad" when the data do not answer the question we want to answer or the data make our organization look less favorable than we would like. All of us want to believe that the data we can get our hands on can be used to address current needs. Our desire to find an answer sometimes causes us to overlook the fact that the data we have are not the same as the data we need. As the supplier of the warehouse data, you need to understand the data's limitations and communicate these to users. Doing less will result in frustration on the part of users and limit your credibility across campus.
Use unique names for different measures. For example, official reporting requires that a student be counted once and only once. Yet when a student pursues multiple majors every offering unit wants to count the student. It is OK to count both ways but be sure to use different labels for the counts. Do not call them both "Majors." The official count might be
86
called "Majors" and the count the departments want to use might be called "Students Served." They are different measures and must be distinguished as such.
From where do you want to serve the data?
The data need to be served from a place that is as close to the source of the questions as one can get while simultaneously providing access to all consumers who need the data to do their job. One can get too close to the questions and be in an environment that wants to be too possessive about access. One can also be in an environment free to provide the data to everyone that needs it but too far away from the important questions to have the guidance needed to make the offerings meaningful. The University of Arizona reporting data warehouse and query front end originated in the Office of Institutional Research.
The query front end and the data warehouse behind it is a process, not an event, constantly changing in response to new knowledge and information needs. Questions that need to be answered across campus should drive the evolution of the warehouse and its content. Large complicated expensive front-end server architecture is not required. The audience to be served is not huge.
The first front end server implementation in 1994 used MacHTTP and Userland Frontier. Then WebStar and Frontier, and later just Frontier. Frontier is a scripting environment with a persistent database. The scripting language is called UserTalk. The software worked OK, even when handling load distribution across multiple servers. Over time the company targeted Frontier at a different market and priced the product too high for our academic budget. As a result we regrouped and implemented a new server using low cost open source software. At this time, we have a better solution at a lower cost.
The University of Arizona Office of Institutional Research is using a UNIX-based operating system with Apache, PHP, and MySQL for its front end query server. Apache is the widely used Web server that securely handles large traffic volumes. The documentation for PHP opens with "PHP {recursive acronym for "PHP: Hypertext Preprocessor") is a widely used Open Source general-purpose scripting language especially suited for Web development and can be embedded into HTML." PHP is the scripting language used to converse with the consumer, formulate the actual queries, send the queries to the data warehouse, retrieve the results from the data warehouse, build the results into Web pages, and pass the Web pages to the Web server. MySQL is the back end database for maintaining consumer information. The products provide great service at a low cost. One can choose to purchase annual support if desired.
A robust database is required. Individuals responsible for the warehouse want to be sure that the data are secure. Consumers want quick access - their time is very valuable. Minimize the time it takes to load the data into the warehouse so that the time the data are available to consumers can be maximized. Some administrators start their workday early, some end their workday late, and some are in different time zones.
87
Having the data available from 8 to 5 is usually not sufficient. At the time this is being written, the University of Arizona is using Oracle's RDB database software and has been productively doing so since 1990.
You want to serve the data, not work on the servers. Choose operating systems that are inherently stable and generally secure from marauding viruses. At the time this is being written the University of Arizona IR office is using VMS from Hewlett Packard for the database servers and UNIX from Apple for the front end query servers.
When do you want to start serving data?
"Yesterday would be good but now will have to do."
Many data warehouses do not make it into service because they get studied to death. The problems are political, not technical. The longer it takes to get a prototype into service the higher the probability that the much needed capability will be blocked by people with strong attachment to the status quo. The data warehouse can be perceived by some as a threat to their existing power structure. The creation of a data warehouse and the release of data to go into the warehouse may be delayed by individuals who feel their position of power is being threatened.
Delay can also come from those who say "we do not have time to build a data warehouse, we have to focus on improving the quality of the data, responding to information requests, and all the other things that are required by the here and now." Which, of course, is a contradiction!
Just do it- do not study it to death. No matter how long you study and design you are not going to get it right. Needs are constantly changing as the environment is constantly changing and expertise will change as you develop and use the service. While you are studying you are not gaining the productivity leverage you need to deal with increasing reporting requirements, you are not serving data to consumers who need it, and you are not gaining the hands-on knowledge you need to evolve the prototype into a much sought after service. It is better to get the data warehouse and query front end into service early and structure for constant feedback and change.
Do not let a perception of "we can't afford it" keep you from implementing your first data warehouse and query front end. The first version can be implemented with a small incremental investment using the data feeds you already get for "official" reporting and the productivity gains will quickly offset the labor investment.
Similarly, do not let the fact that you implemented your first data warehouse and query front end with a modest investment lull you into thinking you will not have to spend more money in the future. After you and your initial consumers experience the value of your first server you will find yourself, and your consumers, clamoring for more data from more sources with greater frequency. And more people will want to use your service. The good thing is that by then you will be talking about the value of what is as opposed to speculating on what might be. Stay focused on making data available to those who need it to do their job and
88
the benefits gained from doing so.
How do you start serving data?
Prototype quickly and continually refine the product. The initial prototype can be constructed with a modest investment. A Web front end can be built using low cost open source software like Apache and PHP. The back end reporting database can be constructed using a low cost database like MySQL. The operating system can be a UNIX variant. The initial hardware can be hand-me-downs from the last technology refresh.
The initial target audience can be the analysts in the IR office. They need ready access to standardized census data to do their job. Later the targeted audience can be gradually expanded to include people outside the IR office that need access to the same data such as assistant and associate deans, student affairs units, and other administrative and academic units.
As the prototype becomes a sought-after service the investment must become a process not an event. Otherwise success will become failure if you don't have continuing funding to invest in increased capacity and to replace ageing infrastructure.
Be careful about censorship under the guise of security. Are they talking about protecting the data or restricting who has access? Set the database protections so that no consumer can change the data and the data will be "secure." Restricting who can see the data is censorship.
Authenticate and check authorization for users of the Web interface when requesting access to "sensitive" data and authenticate and check authorization for all users of the database. If there is a campus-wide authentication mechanism, use it.
The data should belong to the institution - not individuals. Provide a way for influential consumers to experience the benefit of seeing their data in the context of other organization unit data before seeking official permission to serve the data. Asking permission to serve the data before providing an opportunity for decision makers to experience the benefits usually results in an answer that is safest from the perspective of operational system owners - "no." If given the opportunity to experience the value, people soon realize that they need to see their data in the context of other unit's data and to do that they must be willing for others to see data about their unit.
The data need stewards with an institution-wide perspective. Data access needs to be controlled at the institution boundary, not at the level of each data element. Too frequently censorship is imposed at the level of who inside the institution can see which data element when the focus should be on not violating laws by exposing the data to people outside the institution. People inside the institution need to see the data to do their job. Stewards can add considerable value by tracking externally imposed privacy laws like the Family Educational Rights and Privacy Act (FERPA), Health Insurance Portability and Accountability Act (HIPM), and Gramm-
89
Leach-Bliley Act (GLBA) and keeping the people inside the institution aware of institutional obligations in that regard.
Find people with passion for getting data into the hands of those who need it. Start with a committed executive sponsor to establish and retain resources. Avoid large committees. You want doers, not turf protectors. Expertise is needed for major activities including:
a.Referee, keeper of the calendar, and tracker of changes in institutional need for data. The calendar tells "when" things happen, and "why" things happen. Much confusion can be avoided if people are well aware of the timeliness for data feeds and information production, their relationships, and why they happen when they do.
b. Subject matter experts for coordination, research, and ExtracU Transform/Load/Push or Publish process creation and maintenance. Need minimum of quarter-time person for each non-transitory major system feed and a full-time person or more for systems in transition. Major system feeds might include:
• Assets
• Budget
• Bursar
• Finance
• Payroll
• Personnel
• Purchasing
• Space
• Sponsored Projects (Research)
• Student Admission
• Student Financial Aid
• Student Registration
• Student Degrees Awarded
• Non-University Operational Data
• Peer Institution Data (Data exchanges, IPEDS, etc.)
• Environmental Scan Data
c. Data structure design, structure build process creation, and population process prototyping (where the transformation algorithms get developed).
d.Production process optimization. Data structure build and populate prototypes are by intent structured to make the transformation algorithm discovery and change process efficient. These prototypes will be too slow for daily production. As the prototypes stabilize they have to be converted to production versions. Production processes must be continually optimized to minimize total build times.
90
e.Daily care and feeding of production processes. When the data warehouse is in production there will be data arriving from the production systems every night. Murphy's Law applies. Never underestimate the ability of production processes to be interrupted by unanticipated glitches that must be expeditiously dealt with to have data available for start-of-business-current day.
f. Query server creation and maintenance. Buy or build and maintain software tools to enable Web-based querying of the data in the data warehouse. Create and maintain server queries and associated summary tables in back end databases.
g.History transformation and loading. The past must not be abandoned. It is the historical context. Processes have to be built to transform the past data and load it into future structures.
h.Mapping and code table maintenance. Tables like org_map, college_codes, course_to_deptabr, degree_to_deptabr, cip_codes, institution_codes, etc. have to be created and maintained. Communication with code changers must be established to know when codes change and to convince code changers to NOT reuse old codes. The same is true for financial structure changes such as assignment of new or movement of existing department numbers. And, of course, tracking organization changes.
i. System Management. The clusters of computer processors, attached disk drive farms, system software, and production builds that comprise the servers must be managed and maintained.
The Web front end and both data warehouses at the University of Arizona were created and maintained for the first seven years by approximately 3 FTE. Staffing is approximately 4.25 FTE. Staffing needs to double to address current institution-wide data and information demands and to deal with the complete replacement of the student information system that is in progress as this is being written.
Provide a data warehouse. There are two data warehouses at the University of Arizona. The first data warehouse is called UIS for University Information System. The UIS is the operational data store containing daily operational system data from payroll, finance, student, and space systems. The UIS is staffed and funded from the central IT office.
The second data warehouse is called IIW for Integrated Information Warehouse. The IIW is the reporting database containing the census data (operational data, primarily from UIS, frozen in time) including personnel
91
data snapshots at start of business current week and quarterly intervals, space data biweekly and annual, finance data monthly and annual, and student data snapshots taken on the 21st day of each term, grades when posted, and degrees awarded. The IIW is staffed and funded from the central IR office.
The use of two warehouses has worked extremely well for the University of Arizona. But, as is frequently the case, success has been dependent on the makeup of the principle parties involved. The difference in reporting hierarchy could be a problem if the people involved had more normal allegiances to organization hierarchy.
There are cultural differences between the two data warehouses.
The operational data store has to essentially recreate itself every night. Its goal is to reflect the state of the institution as of start-of-business-current day. Its data transformation and load processes have to be very efficient. In contrast, the reporting data warehouse loads data in much lower volumes and with lesser frequency. There is more freedom to prototype new products.
Another cultural difference is that the consumer base for the operational data store is typically interested in very granular data, data down to the individual transaction. This attracts the attention of people who want to control who can see what. Whereas the reporting data warehouse deals more in summary data.
The downside of having separate data warehouses has been the lack of one-stop-shopping for some consumers. This is addressed for some consumers with the front-end query server, which accommodates queries against both data warehouses without the consumer seeing the difference. And, some information products have been cross-replicated to make them available in both data warehouses.
We believe that multiple databases are a correct approach.
However, we would change what goes where. We've referred to them as wholesale and retail. Ralph Kimball calls them staging and presentation. Kimball says the data staging area is "where production data from many sources is brought in, cleaned, conformed, combined, and ultimately delivered to the data warehouse presentation systems."
We are considering using two presentation systems to help deal with the problem of consumers wanting the data to be available more hours each day and simultaneously it is taking longer and longer each day to load data into the warehouse because of the increasing volume and transformation complexity. We would load data into one database while consumers use the other database. At an appropriate time we would switch the pointers so that consumers start using the database we just finished loading and we start reloading the database the consumers just stopped using. That way loading and consuming can go on in parallel without getting in each other's way and the consumers would see only one database.
Provide for Web browser access to the data warehouse. You need a way for consumers to access the data warehouse without requiring
92
changes to the consumer's desktop computers. Desktop support can consume all of your resources if you let it.
At the University of Arizona we have multiple Web sites (virtual hosts that look like data marts) serving different constituencies:
a.Deans (authentication required) b.Administrators (authentication required)
c. Advisors (authentication required)
d.Human Resources (authentication required) e.General (on campus access only)
The Web sites front end both data warehouses so consumers "see" the data warehouses as a single source of data and do not see the underlying complexity. Consumers can query data using their Web browser and get results back as Web pages and as spreadsheets. Most queries start with organization selection from an outline (provided in the Web access) and the data is summarized on-the-fly to the selected organization level. Here is where Kimball's dimensional model approach adds considerable value. A way is provided for consumers to request new queries.
Caching is used to reduce response times. Every morning after the nightly data loads are completed a scheduler process "wakes up" and starts looking for queries that access data tables that changed since the last time the queries were run. When the process finds such a query it causes the query to run and save its results. That way when a consumer triggers the query later the most recent results will be ready for delivery.
Let the people with passion choose their tools. Self-fulfilling prophecy is a powerful force. People work harder to fulfill their own prophecy than they do to fulfill someone else's prophecy. There are several different combinations of software and underlying computer hardware that can be used to provide data delivery services. The people who dedicate themselves to providing the service should be given the opportunity to choose the tools they think will enable them to do the best job.
Study Ralph Kimball's writings on data warehousing (http:// www.rkimball.com/). Data structures for reporting are different from data structures for operational systems. Operational system structures must provide for and facilitate quick response to data updates. Reporting structures must focus on quick response to inquiries.
The data structures in the reporting (or presentation as Kimball calls it) data warehouse should be independent from the structures in the operational system sources. The structures in the reporting data warehouse should be able to survive replacement of the operational systems with minimal structure change. This will isolate the reporting processes from changes in the operational systems. The processes that populate the reporting structures will have to change. But this is much
93
easier and less expensive than having to change all the report creation processes.
When designing data structures it is good to remember that we can aggregate but we can't disaggregate. The appropriate level of granularity of the data is important. For example, assume that financial expenditures occur at the "account" level with multiple accounts linked to individual departments. If we summarize or aggregate expenditure data to the department level then we lose whatever knowledge might be associated with accounts and there is no way for a query to disaggregate those summarized expenditures into their original accounts. In contrast, if we keep the data at the more granular account level we can always aggregate the account data to get totals at the department level. The reporting data warehouse is structured for reporting, not updating, so it is OK to have the data in both granular and summarized forms when summarization will facilitate quicker response to inquiry.
Use mapping tables to guide data summarization. Examples at the University of Arizona include the organization map, major and degree to organization map, course to organization map, accounts to department numbers map, and department numbers to organization map.
a.The organization map records the hierarchical reporting relationships between organization units. Department abbreviations and department numbers are included on the rows in the organization map where the corresponding data associated with such identifiers enters the organization hierarchy. At the University of Arizona department abbreviations are used in the student data and department numbers are used in other data such as personnel and finance.
b. The major and degree mapping table apportions credit for programs (major + degree) to organization units using department abbreviations and percentages. This includes single programs with one or two majors and dual programs each with one or two majors.
c. The course to organization mapping table records which organization unit offers which courses.
This mapping architecture enables the reporting of comparison data as if the University was always organized as it is today. This is extremely important as the University's academic and administrative organization is always evolving. Multiple data sets can provide context for measurements but only if the historical context is consistent with today's structures. For example, what if the College of Architecture now includes landscape planning which used to be in the College of Agriculture. The usual approach to explaining the step change in the numbers for both Architecture and Agriculture is to include a lot of footnotes whose effect is
94
difficult to see in the charts and graphs and spreadsheets. Instead, assume the historical numbers are rolled up organizationally exactly the way they are today. Architecture and Agriculture will appear as if landscape planning has always been in Architecture. It makes context far more relevant and easier to interpret.
Code translation tables are another important part of the data structure. Many codes are internal to the institution and some are externally defined. All need to be translated for human consumption.
F equently it is good to have both long and short translations. The short translations are useful in columnar reports, especially when needed for headings.
Keep track of inter- and intra-table and query dependencies. When you need to change a table, which other tables and which queries will be affected? Know which queries use which tables and which tables depend on the content of which other tables. Also record the reason each index was created. Know which queries may be affected by a change to a particular index.
Watch for opportunities to construct reusable standardized tools for doing repetitive tasks. Examples include dropping all indices on a table, setting protections on a table, exporting a table, importing a table, checking for the presence of a file, logging table changes, and synchronizing table content across multiple databases.
Change the data at the source. Do not patch or clean the data in the warehouse. Repeat. Do not change the data in the warehouse. Changing the data in the warehouse does not get the problem resolved at the source and future snapshots will contain the same problems. Changing the data at the source focuses attention on where bad data originates, where the responsibility lies, and what can/must be done to increase the quality of the data. The frequency of bad data in official snapshots will be reduced over time when the data are corrected at the source.
Use upstream edits to help catch the need for data corrections before critical data snapshots are taken. One example is the aforementioned quarterly snapshots of personnel data. The data are obtained from the operational data warehouse on the appropriate days. Prior to the designated snapshot date, audits are run against the data in the operational data warehouse to detect the existence of anomalies that have occurred in the past. When new anomalies are detected tests are added to the audit set.
Another example, at the University of Arizona is the student data snapshot taken on the official 21s t day of the fall and spring terms. Data snapshots are taken on the 1s t , 11 t h , and actual (as opposed to official) 21s t day to enable checking of the data before the final snapshot date.
Responsibility for the quality of the data should rest with the originators or suppliers of the data. Frequently, the people who complain most about its quality supply data. Help them make the connection
95
between getting the data right at the source quality data in the warehouse.
Some consumers will want direct access to the data warehouse. Analysts in central and distributed "IR" offices, keepers of college and departmental data marts, and consumers with tools such as BrioQuery and Access, and a desire to mine the data on their own will want direct access. Direct access consumers will often prefer all of the data to be in a single database.
Documentation and Training never happens. Everybody wants documentation and training but they want somebody else to provide it for free. One way to address this issue is to develop a communicating "community" to help each other. The community needs a common place to ask questions and get answers from their colleagues. Use electronic tools like RSS feeds, biogs, and listservs (as a last resort) and use the electronic communication tools to keep a searchable history. "Encourage" subject matter experts to regularly monitor and contribute to the electronic exchanges. Use leveraged support. Support the supporters in the distributed college and departmental "IT" units.
Data definitions need to come from the originators or suppliers of the data. Data definitions are context dependent. The providers of the data warehouse and query front end are brokers between the originators and consumers of the data. The brokers need to explain the algorithms used to combine source data to derive new data elements. And, consumers need to define the data in the context in which the data are used.
Have a good backup strategy. At the University of Arizona we use hardware replaced by the last technology refresh to construct geographically disbursed redundant systems. The primary systems are backed up to tape daily and the backup tapes are loaded on the redundant systems. That ensures that the backup tapes are readable and provides a hot standby system. The geographically disbursed backup systems help ensure that disasters such as fire or flood or vandalism at the primary site won't affect the ability to continue providing service. Also, it is helpful to have the backup systems on separate network connections to reduce the probability of losing network connectivity at the same time as the primary site
Read the logs - get clues. The Web server logs can help you identify inquiry trends that can be addressed with new queries and find queries that need to be re-engineered to improve response times. The old adage to "pave the foot paths" applies to the creation of queries to address common needs.
Market your products. The decision makers need to know your products exist and how to get to them. Live demonstrations are a good way to spread the word. Offer to do one-on-one introductions for new
96
administrators. Offer to visit academic units (colleges and departments) with a laptop and a projector to demonstrate the query front end to deans and their associate and assistant deans. Offer to do live demonstrations for groups such as the college academic administrators' council and college academic business officers.
Another successful strategy has been to offer operational activity related queries on the query front end. Examples are payroll expenditure listings, employee rosters, sponsored project activity, and account balances. Addressing day-to-day operational data needs attracts people to the query front end where they find much more to help them make data-informed-decisions.
Examples of Web Server Queries
Organization
1. Get standard organization profile at College, Department, or Program level.
2. Create custom organization profile at College, Department, or Program level.
3. Get organization map at College, Department, or Program level.
4. Get department numbers, accounts, programs, or courses that link to selected organization units.
5. Locate organization unit with specified department abbreviation, department number, or account.
6. Locate organization units whose name contains specified string.
Personnel
1. Get Personnel Profile at department or program level. (demographics, funding sources, time in classification, compensation history, sponsored project activity, student credit hours, and courses taught by selected persons in selected organization units.)
2. Get Salary Comparison for administrators, faculty, graduate students, professionals, or staff, or select by title, or
3. select by pay grade. (demographics and salary information for people in selected organization units that have a title in selected categories.)
4. Get Personnel Funding Source distribution by dollars or percent. (funding sources for last 12 months for people in selected organization units.)
5. Get Time in Classification for selected persons by organization or person's name. (approximate time in job classification derived from snapshots of personnel data).
6. Get Compensation History for selected persons by organization or person's name.
7. Get employee roster for selected organization unit.
8. Get employee ethnicity or gender by organization and fiscal year.
97
9. Locate employees by name or title.
Research
1. Get Sponsored Project Activity by organization unit as recorded in SPINS. (org unit, person, percent responsible, percent effort, proposal id, start date, end date, requested amount, proposal status, awarded amount, and IDC rate for selected organization units.)
2. Get Sponsored Project Revenue as recorded in FRS. (sponsored project revenue for current and preceding nine fiscal years for selected organization units.)
3. Get Sponsored Project Average Indirect Cost Recovery rate. (sponsored project average indirect cost recovery rate for current and preceding nine fiscal years for selected organization units.)
4. Get Principal Investigators whose proposal title keywords contain specified string.
5. Get Sponsored Project Activity by principal investigator as recorded in SPINS. (person, percent responsible, percent effort, proposal id, start date, end date, requested amount, proposal status, awarded amount, and IDC rate for selected principal investigators.)
Instruction
Enrollment
1. Get Enrollment Highlights for Fall and Spring terms.
2. Get Undergraduate Enrollment By High School.
3. Get Graduate enrollment by country, or country and institution, or country and institution and program.
4. Get Program Enrollment by organization or program.
5. Get Course Enrollment on 21st day or from SIS via UIS including future terms.
6. Get Course Enrollment for General Education for Tier 1 on 21st day or Tier 1 from SIS via UIS including future terms or Tier 2 on 21st day or Tier 2 from SIS via UIS including future terms.
7. Get list of courses that may be under-enrolled from SIS/UIS.
Majors
1. Get Majors or Students Served for all Colleges for most recent 10 Fall terms.
2. Get Majors or Students Served by organization, attributes, and terms.
3. Also see the "Program" queries in the "Enrollment" section above.
Student Credit Hours (SCH)
1. Get Student Credit Hours (SCH) for all Colleges for most recent 10 Fall terms.
98
2. Get Student Credit Hours (SCH) by organization, factbook group, and instructor.
3. Get Student Credit Hours (SCH) for General Education at Tier 1 or ner 2.
4. Courses Taught by organization, term, and instructor.
5. Average high school GPA, SAT, and ACT scores for first time full time freshmen by organization unit.
Cumulative Grade Point Average
1. Get Average (Cumulative Grade Point Average).
2. Get Distribution of Cumulative Grade Point Average.
a. Retention by Overall, Term/Gender, Gender/Term, Term/ Ethnicity, Ethnicity/Term, or Ethnicity/High School/Term.
Degrees
1. Get Degrees or Degree Recipients for all Colleges for most recent 1O Fall terms.
2. Get Degrees or Degree Recipients by organization, attributes, and terms.
3. Get Degree Output for most recent 9 degree cycles (3 years), selected terms, or selected terms with totals for each term.
4. Get Programs Awarded by organization or program.
Finance
1. Get budget available by selectable organization units, detail, and fiscal years.
2. Get expenditures by selectable organization units, detail, and fiscal years.
3. Get account balances (similar to FBM090).
4. Get Payroll Expenditure List for current pay period, current fiscal year to date, previous fiscal year, or specify accounts and earn date range.
Assets
1. Specify Purchase Order Nbr and get Atag, Serial Number, and Description.
2. Specify A tag Nbr and get POnbr, Serial Number, and Description.
3. Specify Serial Nbr and get POnbr, Atag, and Description.
99
REFERENCES
AIR Newsletter, September 14, 1992. Original source lost in antiquity.
Alter, S. (1991). Information systems: a management perspective.Reading, Massachusetts: Addison-Wesley.
Balkan, L., Mclaughlin, G. W. (1992). A new data management culture for our new organizations. Paper presented at Data Administration Management Association Annual Meeting.
Balkan, L., Mclaughlin, G. W., & Harper, B. (1992). Building the standards foundation for quality information from distributed systems. CAUSE/EFFECT, Winter, pp.33-34.
Balkan, L., & Sheldon, P. (1990). Developing guidelines for IRM: a grassroots process in a decentralized environment. CAUSE/EFFECT, V. 13, Summer, pp. 25-33.
Balkan, L., Mclaughlin, G. W., & Howard, R. D. (1992). Distributed data management: people processes that build quality. Proceedings of the 1992 National CAUSE Conference.
Data Administration Management Association (DAMA) (1993). Manual for data administration. In J. J. Newton, & D. G. Wald, (Eds). NIST Special Publication 500-208. Gathersburg, Maryland: NIST.
Deal, T. E., & Kennedy, A. A. (1982). Corporate cultures: the rites and rituals of corporate life. Reading, Massachusetts: Addison-Wesley.
Durell, W. R. (1985). Data administration: a practical guide to successful data administration. New York, New York: McGraw-Hill.
Drucker, P. F. (1985). Innovation and entrepreneurship. New York, New York: Harper and Row.
Geller, E. S. (1989). Applied behavior analysis and social marketing: an integration for environmental preservation. Journal of Social Issues, V. 45, No. 1, pp. 17-36.
Gitlow, Howard S. and Gitlow, Shelly J. (1987).The Deming guide to quality and competitive position. Englewood Clifts, NJ: Prentice-Hall, Inc.
Goodhue, Kirsch, Quillard, & Wybo (1992). Strategic data planning: lessons from the field. MIS Quarterly, p. 25.
Hansen, Morten T., Nohria, Nitin, and Tierney, Thomas (2001) in Harvard Business Review on Organizational Learning, Harvard Business School Press, Boston, MA, 61-86
Hackathorn, R. (1995). Data warehousing energizes your enterprise. Datamation, pp. 38-45.
Harper, S. C. (1992). The challenges facing CEOs, past, present, and future. The Executive, V. VI, No. 3, pp. 10-11.
100
Howard, R. D., McLaughlin, G. W., & McLaughlin, J. S. (1989).
Bridging the gap between the database and user in a distributed environment. CAUSE/EFFECT, V. 12, Summer, pp. 19-25.
Inmon, W. H. (1993). Building the data warehouse. Boston, Massachusetts: QED Publishing Group.
King, B. (1989). Better designs in half the time. Methuen, Massachusetts: GOAUQPC.
Kubler-Ross, E. (1974). Questions and answers on death and dying.
New York, New York: McMillan.
McLaughlin, G. W., & McLaughlin, J. S. (1989). Barriers to information use: the organizational context in enhancing information use in decision making. In P. T. Ewell (ED.), New directions in institutional research, No. 64, San Francisco, California: Jossey-Bass.
McLaughlin, G. W. & Howard, R. D. (1991). Check the quality of your information support. CAUSE/EFFECT, V. 14, Spring, pp. 23-27.
McLaughlin, G. W., Teeter, D. J., Howard, R. D., & Schots, J. S. (1987). The influence of policies on data use. CAUSE/EFFECT, January, pp. 6-10.
Merlyn, V. (1992). The critical few. Information Week, October, p.
40.
Miles, M. B., & Huberman, A. M. (1994). Qualitative data analysis.
Thousand Oaks, California: SAGE Publications.
Mintzberg, H. (1973). The nature of managerial work. Englewood Cliffs, New Jersey: Prentice-Hall.
Miselis, K. L. (1990). Organizing for information resource management in organizing effective institutional research offices. In J.B. Presley (ED.), New directions for institutional research. San Francisco, California: Jossey-Bass.
Peck, M. S. (1987). The different drummer-community making and peace. New York, New York: Simon & Schuster, Inc.
Plice, S. J. (1992). Changing the culture: implementing TQM in an IT organization. CAUSE/EFFECT, Summer, p. 23.
Radding, A. (1992). Quality is job #1. Datamation, October, p. 100.
Rifkin, J. with Howard, T. (1981). Entropy: a new world view. New York, New York: Bantam Books.
101
Reckart, J. F., & Delong, D. W. (1988). Executive support systems.
Homewood, Illinois: Dow Jones-Irwin.
Senge, P. (1990). The fifth discipline. New York, New York: Currency Doubleday.
Silverman, D. (1993). Interpreting qualitative data. Thousand Oaks, California: SAGE Publications.
Simon, H. A. (1983). Methods of bounded rationality. V. 2, Boston, Massachusetts: MIT Press.
Stares, A., & Corbin, J. (1990). Basics of qualitative research.
Newbury Park, California: Sage Publications.
Stringer, R. A. with Uchenick, J. L. (1986) Strategy traps and how to avoid them. Lexington, Massachusetts: Lexington Books.
Tapscott, D. (1992). The paradigm shift. Information Week. New York, New York: McGraw-Hill.
Tasker, D. (1998, February 6). IBM repository on its way.
Computerworld, 87-90.
The Rise of Managerial Computing. (1986). In J. F. Reckart, & C. V. Bullen, (Eds.), Homewood, Illinois: Dow Jones-Irwin.
Tiwana, Amrit. (2002). The Knowledge management toolkit: Orchestrating IT, Strategy. and knowledge platforms, (2nd edition), Upper Sadie River, NJ: Prentice Hall PTR.
Tzu, S. (1971). The art of war. Translated by Samuel B. Griffith. New York, New York: Oxford University Press.
Waldrop, M. M. (1993). Complexity: the emerging science at the edge of order and chaos. New York, New York: Simon and Schuster.
Readings in information systems: a managerial perspective. (1988).
In J. C. Wetherbe, V. T. Dock, & S. L. Mandell, (Eds.), St. Paul, Minnesota: West Publishing Co.
Wurman, R. S. (1990). Information anxiety. New York, New York: Bantam Books.
Last modified: Tuesday, June 14, 2022, 12:34 PM