Reading: Lesson 5 - Trading Procedures, Types of Stock Market Transactions, & Stock Market Returns
1.5.A - Trading Procedures in Financial Markets, Types of Stock Market Transactions, & Stock Market Returns
1. Physical Location versus Electronic Network
- A secondary market can be either a physical location exchange or a computer/telephone network. For example, the New York Stock Exchange, the American Stock Exchange (AMEX), the Chicago Board of Trade (the CBOT trades futures and options), and the Tokyo Stock Exchange are all physical location exchanges. In other words, the traders actually meet and trade in a specific part of a specific building.
- NASDAQ, which trades a number of U.S. stocks, is a network of linked computers. Other network examples are the markets for U.S. Treasury bonds and foreign exchange, which operate via telephone and/or computer networks. In these electronic markets, the traders never see one another except maybe for cocktails after work.
- By their very nature, networks are less transparent than physical location exchanges. For example, credit default swaps are traded directly between buyers and sellers, and there is no easy mechanism for recording, aggregating, and reporting the transactions or the net positions of the buyers and sellers.
2. Matching Orders: Auctions, Dealers, and ECN's
- The second dimension is the way orders from sellers and buyers are matched. This can occur through an open outcry auction system, through dealers, or by automated order matching. An example of an outcry auction is the CBOT, where traders actually meet in a pit and sellers and buyers communicate with one another through shouts and hand signals.
- In a dealer market, there are “market makers” who keep an inventory of the stock (or other financial instrument) in much the same way that any merchant keeps an inventory. These dealers list bid quotes and ask quotes, which are the prices at which they are willing to buy or sell. Computerized quotation systems keep track of all bid and asked prices, but they don’t actually match buyers and sellers. Instead, traders must contact a specific dealer to complete the transaction. NASDAQ (U.S. stocks) is one such market, as is the London SEAQ (U.K. stocks).
- The third method of matching orders is through an electronic communications network (ECN). Participants in an ECN post their orders to buy and sell, and the ECN automatically matches orders. For example, someone might place an order to buy 1,000 shares of IBM stock—this is called a “market order” because it is to buy the stock at the current market price. Suppose another participant had placed an order to sell 1,000 shares of IBM, but only at a price of $91 per share, and this was the lowest price of any “sell” order. The ECN would automatically match these two orders, execute the trade, and notify both participants that the trade has occurred. The $91 sell price was a “limit order” as opposed to a market order because the action was limited by the seller. Note that orders can also be limited with regard to their duration. For example, someone might stipulate that they are willing to buy 1,000 shares of IBM at $90 per share if the price falls that low during the next two hours. In other words, there are limits on the price and/or the duration of the order. The ECN will execute the limit order only if both conditions are met.
- Two of the largest ECNs for trading U.S. stocks are INET (owned by NASDAQ) and Arca (owned by NYSE Euronext). Other large ECNs include Eurex (an ECN for derivatives, owned by the Deutsche Börse) and SETS (a stock exchange owned by the SIX Swiss Exchange). Notice that most “conventional” exchanges also operate ECNs.
3. Types of Stock Market Transactions
- Because the primary objectives of financial management are to maximize the firm’s intrinsic value and then help ensure that the current stock price equals that value, knowledge of the stock market is important to anyone involved in managing a business.
- We can classify stock market transactions into three distinct types: (1) initial public offerings, (2) seasoned equity offerings, and (3) secondary market transactions.
- Whenever stock is offered to the public for the first time, the company is said to be going public. This primary market transaction is called the initial public offering (IPO) market. If a company later decides to sell (i.e., issue) additional shares to raise new equity capital, this is still a primary market, but it is called a seasoned equity offering. Trading in the outstanding shares of established, publicly owned companies are secondary market transactions.
- Here is a brief description of recent IPO activity. There were 1,285 total global IPOs in 2011, with total proceeds of $168 billion. China and Hong Kong together represented over 40% of the total. The biggest IPO was the $10 billion raised by Glencore International, a Swiss mining company. In the United States, the average first-day return was around 13% in 2011. However, some firms had spectacular first-day price run-ups, such as LinkedIn’s 109% gain on its first day of trading. Not all companies fared so well—indeed, Friend Finder fell by over 21% on its first trading day.
- Even if you are able to identify a “hot” issue, it is often difficult to purchase shares in the initial offering. In strong markets, these deals generally are oversubscribed, which means that the demand for shares at the offering price exceeds the number of shares issued. In such instances, investment bankers favor large institutional investors (who are their best customers), and small investors find it hard, if not impossible, to get in on the ground floor. They can buy the stock in the aftermarket, but evidence suggests that if you do not get in on the ground floor, the average IPO underperforms the overall market over the long run.
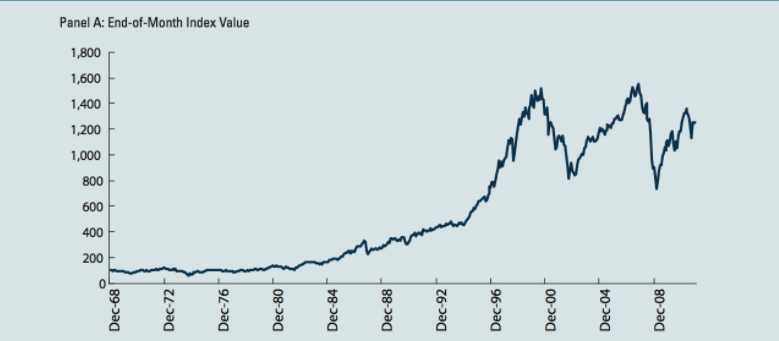
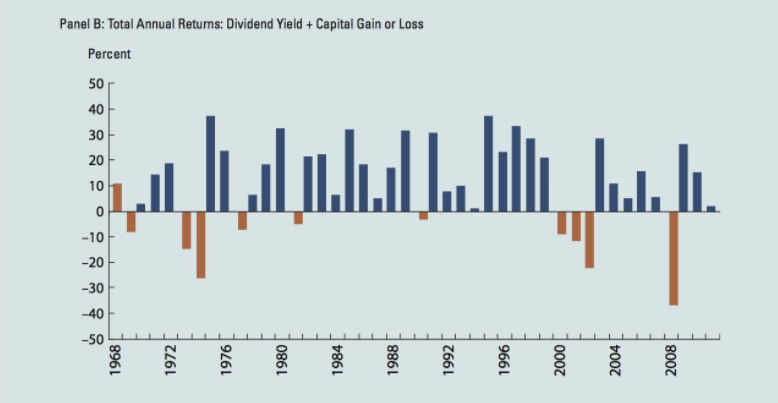
A stock index is designed to show the performance of the stock market. Here we describe some leading indexes:
Dow Jones Industrial Average
Begun in 1896, the Dow Jones Industrial Average (DJIA) now includes 30 widely held stocks that represent almost one-fifth of the market value of all U.S. stocks. See www. dowjones.com for more info.
S&P 500 Index
Created in 1926, the S&P 500 Index is widely regarded as the standard for measuring large-cap U.S. stocks’ market performance. It is value weighted, so the largest companies (in terms of value) have the greatest influence. The S&P 500 Index is used as a comparison benchmark by 97% of all U.S. money managers and pension plan sponsors. See www2. standardandpoors.com for more information.
NASDAQ Composite Index
The NASDAQ Composite Index measures the performance of all common stocks listed on the NASDAQ stock market. Currently, it includes more than 3,200 companies, many of which are in the technology sector. Microsoft, Cisco Systems, and Intel account for a high percentage of the index’s value-weighted market capitalization. For this reason, substantial movements in the same direction by these three companies can move the entire index. See www.NASDAQ.com for more information.
NYSE Composite Index
The NYSE Composite Index measures the performance of all common stocks listed on the NYSE. It is a value weighted index and is based on just over 2,000 stocks that represent 77% of the total market capitalization of all publicly traded companies in the United States. See www.nyse.com for more information.
Trading the Market
Through the use of exchange traded funds (ETFs), it is now possible to buy and sell the market in much the same way as an individual stock. For example, the Standard & Poor’s depository receipt (SPDR) is a share of a fund that holds the stocks of all the companies in the S&P 500. SPDRs trade during regular market hours, making it possible to buy or sell the S&P 500 any time during the day. There are hundreds of other ETFs, including ones for the NASDAQ, the Dow Jones Industrial Average, gold stocks, utilities, and so on.
Last modified: Tuesday, August 14, 2018, 8:37 AM