Reading: Lesson 1: Financial Analysis & Liquidity Ratios
3.1.A - Financial Analysis
1. Conducting Financial Analysis
- The first step in financial analysis is to gather data. Financial statements can be downloaded from many different Web sites. Financial statement analysis involves (1) comparing a firm’s performance with that of other firms in the same industry, and (2) evaluating trends in the firm’s financial position over time. Managers use financial analysis to identify situations needing attention, potential lenders use financial analysis to determine whether a company is creditworthy, and stockholders use financial analysis to help predict future earnings, dividends, and free cash flow.
- Examine the Statement of Cash Flows: Some financial analysis can be done with virtually no calculations. For example, we always look to the statement of cash flows first, particularly the net cash provided by operating activities. Downward trends or negative net cash flow from operations almost always indicate problems. The statement of cash flows section on investing activities shows whether the company has made a big acquisition, especially when compared with the prior years’ net cash flows from investing activities. A quick look at the section on financing activities also reveals whether a company is issuing debt or buying back stock; in other words, is the company raising capital from investors or returning it to them?
- Calculate and Examine the Return on Invested Capital and Free Cash Flow: Calculate and Examine the Return on Invested Capital and Free Cash Flow after examining the statement of cash flows, we calculate the free cash flow (FCF) and return on invested capital (ROIC) as described in Chapter 2. The ROIC provides a vital measure of a firm’s overall performance. If the ROIC is greater than the company’s weighted average cost of capital (WACC), then the company usually is adding value. If the ROIC is less than the WACC, then the company usually has serious problems. No matter what the ROIC tells us about overall performance, it is important to examine specific activities, and to do that we use financial ratios.
- Financial ratios are designed to extract important information that might not be obvious simply from examining a firm’s financial statements. For example, suppose Firm A owes $5 million in debt while Firm B owes $50 million. Which company is in a stronger financial position? It is impossible to answer this question without first standardizing each firm’s debt relative to total assets, earnings, and interest. Such standardized comparisons are provided through ratio analysis.
2. Liquidity Ratios
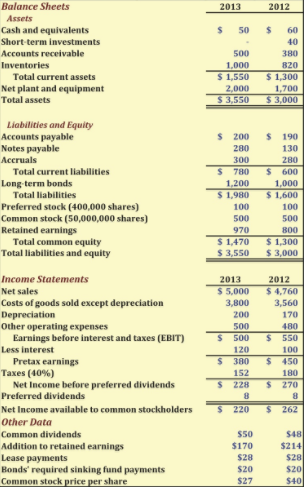
- Current assets normally include cash, marketable securities, accounts receivable, and inventories. Current liabilities consist of accounts payable, short-term notes payable, current maturities of long-term debt, accrued taxes, and other accrued expenses. Consider the current ratio from a shareholder’s perspective. A high current ratio could mean that the company has a lot of money tied up in nonproductive assets, such as excess cash or marketable securities. Or perhaps the high current ratio is due to large inventory holdings, which might become obsolete before they can be sold. Thus, shareholders might not want a high current ratio. An industry average is not a magic number that all firms should strive to maintain— in fact, some well-managed firms will be above the average, while other good firms will be below it. However, if a firm’s ratios are far from the averages for its industry, this is a red flag, and analysts should be concerned about why the variance occur. Calculate the current ratio by dividing current assets by current liabilities:

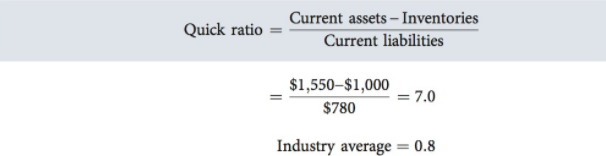
2. A liquid asset is one that trades in an active market, so it can be converted quickly to cash at the going market price. Inventories are typically the least liquid of a firm’s current assets; hence they are the current assets on which losses are most likely to occur in a bankruptcy. Therefore, a measure of the firm’s ability to pay off short-term obligations without relying on the sale of inventories is important. The quick ratio, also called the acid test ratio, is calculated by deducting inventories from current assets and then dividing the remainder by current liabilities:
3. Asset Management Ratios
- Asset management ratios measure how effectively a firm is managing its assets. If a company has excessive investments in assets, then its operating capital is unduly high, which reduces its free cash flow and ultimately its stock price. On the other hand, if a company does not have enough assets, then it may lose sales, which would hurt profitability, free cash flow, and the stock price.
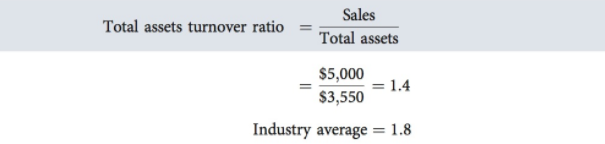
- The total assets turnover ratio measures the dollars in sales that are generated for each dollar that is tied up in assets:
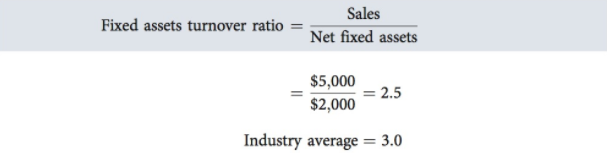
3. Inflation can cause problems when interpreting the fixed assets turnover ratio because fixed assets are reported using the historical costs of the assets instead of current replacement costs that may be higher due to inflation. Therefore, a mature firm with fixed assets acquired years ago might well have a higher fixed assets turnover ratio than a younger company with newer fixed assets that are reported at inflated prices relative to the historical prices of the older assets. However, this would reflect the difficulty accountants have in dealing with inflation rather than inefficiency on the part of the new firm. You should be alert to this potential problem when evaluating the fixed assets turnover ratio. The fixed assets turnover ratio measures how effectively the firm uses its plant and equipment. It is the ratio of sales to net fixed assets:
4. Days sales outstanding (DSO), also called the “average collection period” (ACP), is used to appraise accounts receivable, and it is calculated by dividing accounts receivable by average daily sales to find the number of days’ sales that are tied up in receivables. Thus, the DSO represents the average length of time that the firm must wait after making a sale before receiving cash, which is the average collection period.
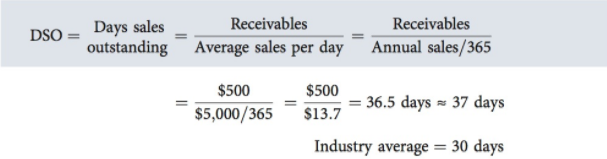
The fact that 37 days of sales are outstanding indicates that customers, on average, are not paying their bills on time. As with inventory, high levels of accounts receivable cause high levels of NOWC, which hurts FCF and stock price. A customer who is paying late may be in financial trouble, which means a firm may have a hard time collecting the receivable. Therefore, if the trend in DSO has been rising unexpectedly, steps should be taken to review credit standards and to expedite the collection of accounts receivable.
5. The inventory turnover ratio is defined as costs of goods sold (COGS) divided by inventories.2 The previous ratios use sales instead of COGS. However, sales revenues include costs and profits, whereas inventory usually is reported at cost. Therefore, it is better to compare inventory with costs rather than sales. Depreciation and the portion of costs of goods sold that is not comprised of depreciation, which is helpful when calculating cash flows. However, we need the total COGS for calculating the inventory turnover ratio. All depreciation is associated with producing its products, so its COGS is:
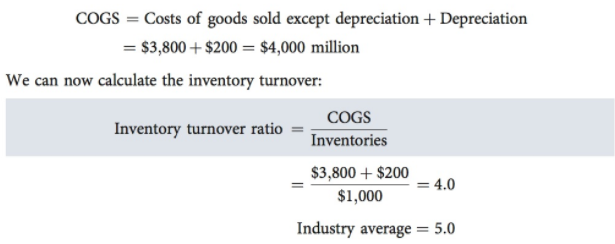
As a rough approximation, each item of the firm's inventory is sold out and restocked, or “turned over,” 4 times per year. The firm’s turnover of 4 is lower than the industry average of 5. This suggests that the firm is holding too much inventory. High levels of inventory add to net operating working capital (NOWC), which reduces FCF, which leads to lower stock prices. In addition, the firm’s low inventory turnover ratio makes us wonder whether the firm is holding obsolete goods not worth their stated value. In summary, the firm’s low fixed asset turnover ratio, high DSO, and low inventory turnover ratio each cause the firm’s total assets turnover ratio to be lower than the industry average.
Last modified: Tuesday, August 14, 2018, 8:39 AM