Reading: Lesson 3 - Profitability Ratios & Market Value Ratio
3.3.A - Profitability Ratios & Market Value Ratio
1. Profitability Ratios
- Profitability is the net result of a number of policies and decisions. The ratios examined thus far provide useful clues as to the effectiveness of a firm’s operations, but the profitability ratios go on to show the combined effects of liquidity, asset management, and debt on operating results.
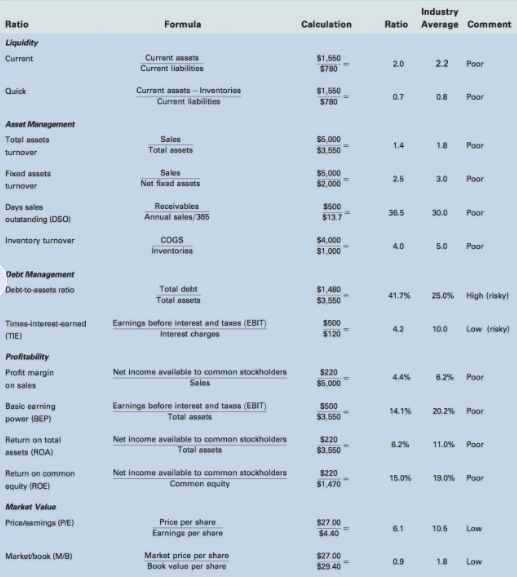
- The net profit margin, also called the profit margin on sales, is calculated by dividing net income by sales. It gives the profit per dollar of sales:
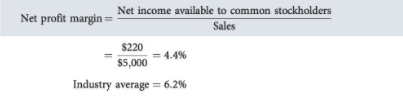
The firm’s net profit margin is below the industry average of 6.2%, but why is this so? Is it due to inefficient operations, high interest expenses, or both? Instead of just comparing net income to sales, many analysts also break the income statement into smaller parts to identify the sources of a low net profit margin.
3. Operating profit margin is defined as:
![]()
The operating profit margin identifies how a company is performing with respect to its operations before the impact of interest expenses is considered. Some analysts drill even deeper by breaking operating costs into their components. For example, the gross profit margin is defined as:
![]()
The gross profit margin identifies the gross profit per dollar of sales before any other expenses are deducted.
2. Basic Earning Power (BEP) Ratio
- The basic earning power (BEP) ratio is calculated by dividing earnings before interest and taxes (EBIT) by total assets:
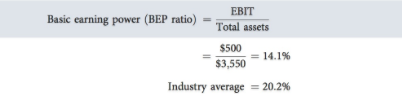
This ratio shows the earning power of the firm’s assets before the influence of taxes and leverage, and it is useful for comparing firms with different tax situations and different degrees of financial leverage. Because of its low turnover ratios and low profit margin on sales, this firm is not getting as high a return on its assets as is the average company in its industry.
3. Return on Common Equity
- The ratio of net income to common equity measures the return on common equity (ROE):
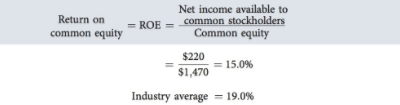
Stockholders invest to earn a return on their money, and this ratio tells how well they are doing in an accounting sense. The firm's 15% return is below the 19% industry average, but not as far below as its return on total assets. This somewhat better result is due to the company’s greater use of debt.
4. Market Value Ratios
- The price/earnings (P/E) ratio shows how much investors are willing to pay per dollar of reported profits. This firm has $220 million in net income and 50 million shares, so its earnings per share (EPS) is $4.40 = $220/50. This firm's stock sells for $27, so its P/E ratio is:
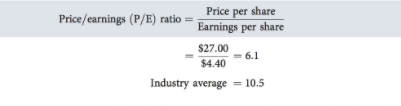
Price/earnings ratios are higher for firms with strong growth prospects, other things held constant, but they are lower for riskier firms. Because this firm’s P/E ratio is below the average, this suggests that the company is regarded as being somewhat riskier than most, as having poorer growth prospects, or both. In early 2012, the average P/E ratio for firms in the S&P 500 was 13.4, indicating that investors were willing to pay $13.40 for every dollar of earnings.
2. Stock prices depend on a company’s ability to generate cash flows. Consequently, investors often look at the price/cash flow ratio, where cash flow is defined as net income plus depreciation and amortization:
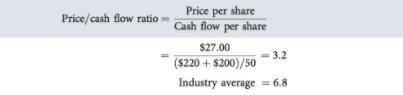
This firm’s price/cash flow ratio is also below the industry average, once again suggesting that its growth prospects are below average, its risk is above average, or both. The price/EBITDA ratio is similar to the price/cash flow ratio, except the price/ EBITDA ratio measures performance before the impact of interest expenses and taxes, making it a better measure of operating performance. This firm’s EBITDA per share is ($500 + $200)/50 = $14, so its price/EBITDA is $27/$14 = 1.9. The industry average price/ EBITDA ratio is 4.0, so we see again that this firm is below the industry average.
3. The ratio of a stock’s market price to its book value gives another indication of how investors regard the company. Companies with relatively high rates of return on equity generally sell at higher multiples of book value than those with low returns. First, we find the firm’s book value per share:
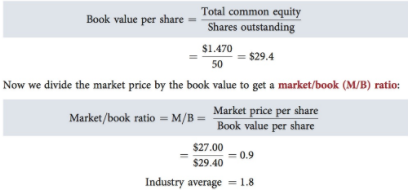
Investors are willing to pay relatively little for a dollar of this firm's book value. The book value is a record of the past, showing the cumulative amount that stockholders have invested, either directly by purchasing newly issued shares or indirectly through retaining earnings. In contrast, the market price is forward-looking, incorporating investors’ expectations of future cash flows.
Остання зміна: вівторок 14 серпня 2018 08:39 AM