Reading: Lesson 4 - Trend Analysis & The DuPont Equation
3.4.A - Trend Analysis & The DuPont Equation
1. Trend Analysis
- Trends give clues as to whether a firm’s financial condition is likely to improve or deteriorate. To do a trend analysis, you examine a ratio over time. In a common size analysis, all income statement items are divided by sales, and all balance sheet items are divided by total assets. Thus, a common size income statement shows each item as a percentage of sales, and a common size balance sheet shows each item as a percentage of total assets.8 The advantage of common size analysis is that it facilitates comparisons of balance sheets and income statements over time and across companies. Common size statements are easy to generate if the financial statements are in a spreadsheet. In fact, if you obtain your data from a source that uses standardized financial statements, then it is easy to cut and paste the data for a new company over your original company’s data, and all of your spreadsheet formulas will be valid for the new company.
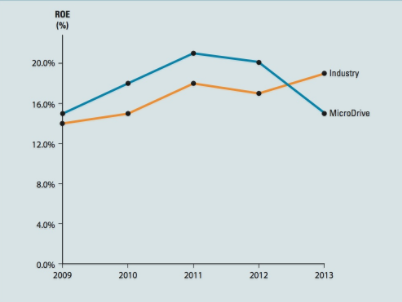
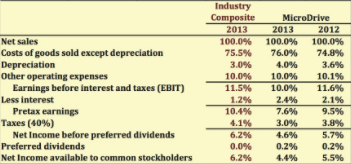
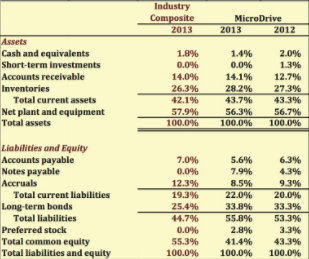
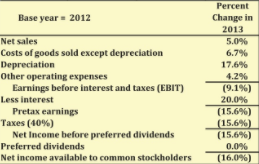
Th above graph's show this firm’s common size balance sheets along with the industry composite. Its accounts receivable are significantly higher than the industry average, its inventories are significantly higher, and it uses much more debt than the average firm. In percentage change analysis, growth rates are calculated for all income statement items and balance sheet accounts relative to a base year. This firm’s income statement percentage change analysis for 2013 relative to 2012. Sales increased at a 5% rate during 2013, but EBIT fell by 9.1%. Part of this decline was due to an increase in depreciation, which is a noncash expense, but the cost of goods sold also increased by a little more than the growth in sales. In addition, interest expenses grew by 20%. We apply the same type of analysis to the balance sheets, which shows that inventories grew at a whopping 22% rate and accounts receivable grew over 31%. With only a 5% growth in sales, the extreme growth in receivables and inventories should be of great concern to this firm’s managers.
2. Tying the Ratios Together: The DuPont Equation
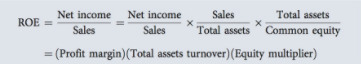
- In ratio analysis, it is sometimes easy to miss the forest for all the trees. In particular, how do managerial actions affecting a firm’s profitability, asset efficiency, and financial leverage interact to determine the return on equity, a performance measure that is important for investors? The extended DuPont equation provides just such a frame work.
- The DuPont equation uses two ratios we covered previously, the profit margin and the total asset turnover ratio, as measures of profitability and asset efficiency. But it also uses a new measure of financial leverage, the equity multiplier, which is the ratio of assets to common equity:
![]()
the extended DuPont equation is:
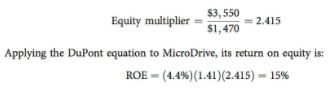
As calculated previously, this firm’s 2013 profit margin is 4.4% and its total assets turnover ratio is 1.41. The firm’s equity multiplier is:
Sometimes it is useful to focus just on asset profitability and financial leverage. Firms that have a lot of financial leverage (i.e., a lot of liabilities or preferred stock) have a high equity multiplier because the assets are financed with a relatively smaller amount of equity. Therefore, the return on equity (ROE) depends on the ROA and the use of leverage:

ROE = 6.20% x 2.415 = 15%
The insights provided by the DuPont model are valuable, and the model can be used for “quick and dirty” estimates of the impact that operating changes have on returns. For example, holding all else equal, if the firm can implement lean production techniques and increase to 1.8 its ratio of sales to total assets, then its ROE will improve to (4.4%) (1.8)(2.415) = 19.1%.
Last modified: Tuesday, August 14, 2018, 8:40 AM