Reading: Lesson 5 - Comparative Ratios and Benchmarking & Uses and Limitations of Ratio Analysis
3.5.A - Comparative Ratios and Benchmarking & Uses and Limitations of Ratio Analysis
1. Comparative Ratios and Benchmarking
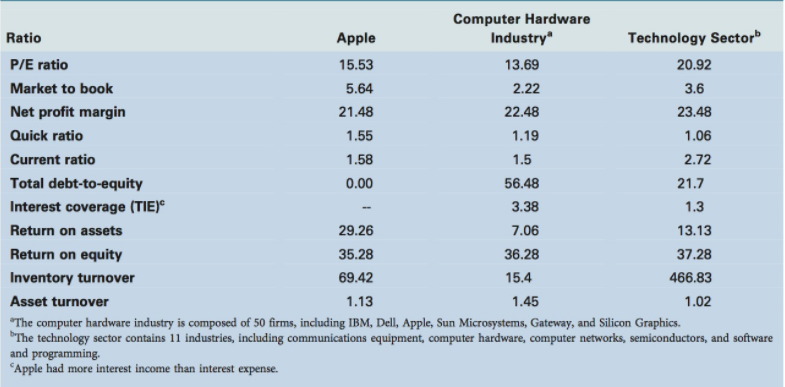
- Ratio analysis involves comparisons. A company’s ratios are compared with those of other firms in the same industry—that is, with industry average figures. This technique is called benchmarking, and the companies used for the comparison are called benchmark companies.
- Comparative ratios are available from a number of sources, including Value Line, Dun and Bradstreet (D&B), and the Annual Statement Studies published by Risk Management Associates, which is the national association of bank loan officers.
- Each data-supplying organization uses a somewhat different set of ratios designed for its own purposes. For example, D&B deals mainly with small firms, many of which are proprietorships, and it sells its services primarily to banks and other lenders. Therefore, D&B is concerned largely with the creditor’s viewpoint, and its ratios emphasize current assets and liabilities, not market value ratios. So, when you select a comparative data source, you should be sure that your own emphasis is similar to that of the agency whose ratios you plan to use. Additionally, there are often definitional differences in the ratios presented by different sources, so before using a source, be sure to verify the exact definitions of the ratios to ensure consistency with your own work.
2. Uses and Limitations of Ratio Analysis
- Ratio analysis provides useful information concerning a company’s operations and financial condition, but it has limitations that necessitate care and judgment.
- Many large firms operate different divisions in different industries, and for such companies it is difficult to develop a meaningful set of industry averages. Therefore, industry averages are more meaningful for small, narrowly focused firms than for large, multidivisional ones.
- To set goals for high-level performance, it is best to benchmark on the industry leaders’ ratios rather than the industry average ratios.
- Inflation may badly distort firms’ balance sheets—reported values are often substantially different from “true” values. Further, because inflation affects depreciation charges and inventory costs, reported profits are also affected. Thus, inflation can distort a ratio analysis for one firm over time or a comparative analysis of firms of different ages.
- Seasonal factors can distort a ratio analysis. For example, the inventory turnover ratio for a food processor will be radically different if the balance sheet figure used for inventory is the one just before versus the one just after the close of the canning season. This problem can be minimized by using monthly averages for inventory (and receivables) when calculating turnover ratios.
- Firms can employ “window dressing” techniques to make their financial statements look stronger. To illustrate, suppose a company takes out a 2-year loan in late December. Because the loan is for more than 1 year, it is not included in current liabilities even though the cash received through the loan is reported as a current asset. This improves the current and quick ratios and makes the year-end balance sheet look stronger. If the company pays the loan back in January, then the transaction was strictly window dressing.
- Companies’ choices of different accounting practices can distort comparisons. For example, choices of inventory valuation and depreciation methods affect financial statements differently, making comparisons among companies less meaningful. As another example, if one firm leases a substantial amount of its productive equipment, then its assets may appear low relative to sales (because leased assets often do not appear on the balance sheet) and its debt may appear low (because the liability associated with the lease obligation may not be shown as debt).
- Conducting ratio analysis in a mechanical, unthinking manner is dangerous. But when ratio analysis is used intelligently and with good judgment, it can provide useful insights into a firm’s operations and identify the right questions to ask.
3. Looking Beyond the Numbers
- Sound financial analysis involves more than just calculating and comparing ratios— qualitative factors must be considered. Here are some questions suggested by the American Association of Individual Investors.
- To what extent are the company’s revenues tied to one key customer or to one key product? To what extent does the company rely on a single supplier? Reliance on single customers, products, or suppliers increases risk.
- What percentage of the company’s business is generated overseas? Companies with a large percentage of overseas business are exposed to risk of currency exchange volatility and political instability.
- What are the probable actions of current competitors and the likelihood of additional new competitors?
- Do the company’s future prospects depend critically on the success of products currently in the pipeline or on existing products?
- How does the legal and regulatory environment affect the company?
Last modified: Tuesday, August 14, 2018, 8:40 AM