Reading: Lesson 4 - Pre-Tax Cost of Debt: Determinants of Market Interest Rates
5.4.A - Pre-Tax Cost of Debt: Determinants of Market Interest Rates
1. Determinants of Market Interest Rates
- Until now we have given you rd, the going market rate. But as we showed in Unit 1, different debt securities often have very different market rates. What explains these differences? In general, the quoted (or nominal) interest rate on a debt security, rd, is composed of a real risk-free rate of interest, r*, plus several premiums that reflect inflation, the risk of the security, and the security’s marketability (or liquidity). A conceptual framework is shown below:
![]()
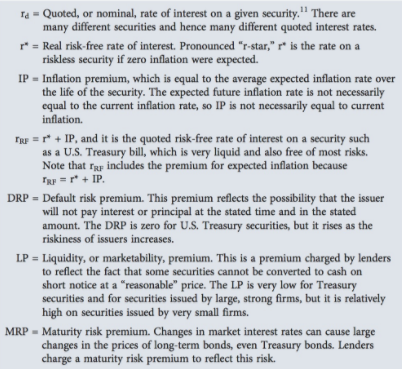
2. The Real Risk-Free Rate of Interest, r*
- The real risk-free rate of interest, r*, is defined as the interest rate that would exist on a riskless security if no inflation were expected, and it may be thought of as the rate of interest on short-term U.S. Treasury securities in an inflation-free world. The real risk-free rate is not static—it changes over time depending on economic conditions, especially (1) the rate of return corporations and other borrowers expect to earn on productive assets, and (2) people’s time preferences for current versus future consumption.
- In addition to its regular bond offerings, in 1997 the U.S. Treasury began issuing indexed bonds, with payments linked to inflation. These bonds are called TIPS, short for Treasury Inflation-Protected Securities. Because the payments (including the principal) are tied to inflation, the yield on a TIPS with 1 year until maturity is a good estimate of the real risk-free rate. In theory, we would like an even shorter maturity to estimate the real risk-free rate, but short-term TIPS are thinly traded and the reported yields are not as reliable.
- Historically, the real interest rate has averaged around 1.5% to 2.5%. In March 2012, the TIPS with about 1 year remaining until maturity had a −2.00% yield. Although unusual, negative real rates are possible. In spring 2008, the combination of stagnant economic growth, a high level of investor uncertainty, fears of inflation, and the Federal Reserve’s reduction in nominal short-term interest rates caused the real rate to fall below zero, as measured by negative yields on several short-term TIPS. The yields on short-term TIPS have remained low since then. Negative real rates are possible, but negative nominal rates are impossible (or at least extraordinarily rare) because investors would just hold cash instead of investing in a negative-yield bond.
3. The Inflation Premium (IP)
- Inflation has a major effect on interest rates because it erodes the purchasing power of the dollar and lowers the real rate of return on investments. To illustrate, suppose you invest $3,000 in a default-free zero coupon bond that matures in 1 year and pays a 5% interest rate. At the end of the year, you will receive $3,150—your original $3,000 plus $150 of interest. Now suppose that the inflation rate during the year is 10% and that it affects all items equally. If gas had cost $3 per gallon at the beginning of the year, it would cost $3.30 at the end of the year. Therefore, your $3,000 would have bought $3,000/$3 = 1,000 gallons at the beginning of the year but only $3,150/$3.30 = 955 gallons at the end. In real terms, you would be worse off—you would receive $150 of interest, but it would not be sufficient to offset inflation. You would thus be better off buying 1,000 gallons of gas (or some other storable asset) than buying the default-free bond.
- Investors are well aware of inflation’s effects on interest rates, so when they lend money, they build in an inflation premium (IP) equal to the average expected inflation rate over the life of the security. For a short-term, default-free U.S. Treasury bill, the actual interest rate charged, rT-bill, would be the real risk-free rate, r*, plus the inflation premium (IP):
![]()
Therefore, if the real short-term risk-free rate of interest were r* = 0.6% and if inflation were expected to be 1.0% (and hence IP = 1.0%) during the next year, then the quoted rate of interest on 1-year T-bills would be 0.6% + 1.0% = 1.6%.
3. It is important to note that the inflation rate built into interest rates is the inflation rate expected in the future, not the rate experienced in the past. Thus, the latest reported figures might show an annual inflation rate of 2%, but that is for the past year. If people on average expect a 6% inflation rate in the future, then 6% would be built into the current interest rate. Note also that the inflation rate reflected in the quoted interest rate on any security is the average rate of inflation expected over the security’s life. Thus, the inflation rate built into a 1-year bond is the expected inflation rate for the next year, but the inflation rate built into a 30-year bond is the average rate of inflation expected over the next 30 years. If It is the expected inflation during year t, then the inflation premium for an N-year bond’s yield (IPN) can be approximated as
![]()
For example, if investors expect inflation to average 3% during Year 1 and 5% during Year 2, then the inflation premium built into a 2-year bond’s yield can be approximated by
![]()
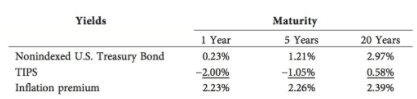
4. In the previous section, we saw that the yield on an inflation-indexed Treasury bond (TIPS) is a good estimate of the real interest rate. We can also use TIPS to estimate inflation premiums. For example, in early 2012 the yield on a 5-year non-indexed T-bond was 1.21% and the yield on a 5-year TIPS was − 1.05%. Thus, the 5-year inflation premium was 1.21% − (−1.05%) = 2.26%, implying that investors expected inflation to average 2.26% over the next 5 years.14 Similarly, the rate on a 20-year non-indexed T-bond was 2.97% and the rate on a 20-year indexed T-bond was 0.58%. Thus, the 20-year inflation premium was approximately 2.97% − 0.58% = 2.39%, implying that investors expected inflation to average 2.39% over the long term.
5. Expectations for future inflation are closely, but not perfectly, correlated with rates experienced in the recent past. Therefore, if the inflation rate reported for last month increases, people often raise their expectations for future inflation, and this change in expectations will cause an increase in interest rates. Note that Germany, Japan, and Switzerland have, over the past several years, had lower inflation rates than the United States, so their interest rates have generally been lower than ours. South Africa, Brazil, and most South American countries have experienced higher inflation, which is reflected in their interest rates.
4. The Nominal, or Quoted, Risk-Free Rate of Interest, rRF
- The nominal, or quoted, risk-free rate, rRF, is the real risk-free rate plus a premium for expected inflation: rRF = r* + IP. To be strictly correct, the risk-free rate should mean the interest rate on a totally risk-free security—one that has no risk of default, no maturity risk, no liquidity risk, no risk of loss if inflation increases, and no risk of any other type. There is no such security, so there is no observable truly risk-free rate. When the term “risk-free rate” is used without either the modifier “real” or the modifier “nominal,” people generally mean the quoted (nominal) rate, and we will follow that convention in this book. Therefore, when we use the term “risk-free rate, rRF,” we mean the nominal risk-free rate, which includes an inflation premium equal to the average expected inflation rate over the life of the security. In general, we use the T-bill rate to approximate the short-term risk-free rate and use the T-bond rate to approximate the long-term risk-free rate (even though it also includes a maturity premium). So, whenever you see the term “risk-free rate,” assume that we are referring either to the quoted U.S. T-bill rate or to the quoted T-bond rate. Because rRF = r* + IP, we can express the quoted rate as
![]()
Last modified: Tuesday, August 14, 2018, 8:42 AM