Reading: Lesson 6 - The Fama French Three-Factor Model
6.6.A - The Fama French Three-Factor Model
1. The Fama French Three-Factor Model
- The figure below shows the returns for 25 portfolios formed by Professors Eugene Fama and Kenneth French. The Fama-French portfolios are based on the company’s size as measured by the market value of its equity (MVE) and the company’s book- to-market ratio (B/M), defined as the book value of equity divided by the market value of equity. Each row shows portfolios with similarly sized companies; each column shows portfolios whose companies have similar B/M ratios. Notice that if you look across each row, the average return tends to increase as the B/M ratio increases. In other words, stocks with high B/M ratios have higher returns. If you look up each column (except for the column with the lowest B/M ratios), stock returns tend to increase: Small companies have higher returns.
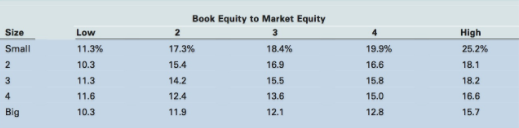
- This pattern alone would not be a challenge to the CAPM if small firms and high B/M firms had large betas (and thus higher returns). However, even after adjusting for their betas, the small-stock portfolios and the high B/M portfolios earned returns higher than predicted by the CAPM. This indicates that (1) markets are inefficient or (2) the CAPM isn’t the correct model to describe required returns.
- In 1992, Fama and French published a study hypothesizing that the SML should have three factors rather than just beta as in the CAPM.24 The first factor is the stock’s CAPM beta, which measures the market risk of the stock. The second is the size of the company, measured by the market value of its equity (MVE). The third factor is the book-to-market ratio (B/M).
- When Fama and French tested their hypotheses, they found that small companies and companies with high B/M ratios had higher rates of return than the average stock, just as they hypothesized. Somewhat surprisingly, however, they found that beta was not useful in explaining returns. After taking into account the returns due to the company’s size and B/M ratio, high-beta stocks did not have higher than average returns and low-beta stocks did not have lower than average returns.
- In 1993, Fama and French developed a three-factor model based on their previous results. The first factor in the Fama-French three-factor model is the market risk premium, which is the market return, −r M, minus the risk-free rate, −r RF. Thus, their model begins like the CAPM, but they go on to add a second and third factor.26 To form the second factor, they ranked all actively traded stocks by size and then divided them into two portfolios, one consisting of small stocks and one consisting of big stocks. They calculated the return on each of these two portfolios and created a third portfolio by subtracting the return on the big portfolio from that of the small one. They called this the SMB (small minus big) portfolio. This portfolio is designed to measure the variation in stock returns that is caused by the size effect.
- To form the third factor, they ranked all stocks according to their book-to-market ratios (B/M). They placed the 30% of stocks with the highest ratios into a portfolio they called the H portfolio (for high B/M ratios) and placed the 30% of stocks with the lowest ratios into a portfolio called the L portfolio (for low B/M ratios). Then they subtracted the return of the L portfolio from that of the H portfolio to derive the HML (high minus low) portfolio. The resulting model is shown below:
![]()
7. When this model is applied to actual stock returns, the “extra” return disappears for portfolios based on a company’s size or B/M ratio. In fact, the extra returns for the long-term stock reversals that we discussed in an earlier Section also disappear. Thus, the Fama-French model accounts for the major violations of the EMH that we described earlier.
8. Because the Fama-French model explains so well a stock’s actual return given the return on the market, the SMB portfolio, and the HML portfolio, the model is very useful in identifying the market’s reaction to news about a company. For example, suppose a company announces that it is going to include more outsiders on its board of directors. If the company’s stock falls by 2% on the day of the announcement, does that mean investors don’t want outsiders on the board? We can answer that question by using the Fama-French model to decompose the actual return of the company on the announcement day into the portion that is explained by the environment (i.e., the market and the SMB and HML portfolios) and the portion due to the company’s announcement.
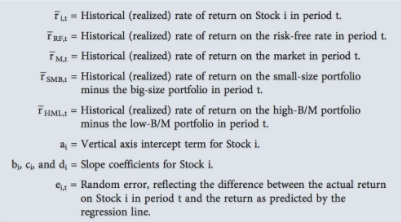
9. To do this, we gather a sample of data (r i,t, r RF,t, r M,t, r SMB,t, and r HML,t) for T periods prior to the announcement date and then run a regression using a previous Equation. (This is similar to the way in which we estimated beta in a previous Section except we are estimating more than one slope coefficient in a multiple regression.) Suppose the estimated coefficients are: ai = 0.0, bi = 0.9, ci = 0.2, and di = 0.3. On the day of the announcement, the stock market had a return of −3%, the rSMB portfolio had a return of −1%, and the rHML portfolio had a return of −2%. The annual risk-free rate was 6%, so the daily rate is 6%/ 365 = 0.01%, which is so small that it can be ignored. The predicted value of the error term in the Fama-French model, ei,t, is by definition equal to zero. Based on these assumptions, the predicted return on the announcement day using the Fama-French three-factor model is:
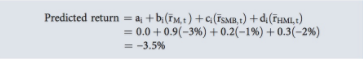
The unexplained return is equal to the actual return less the predicted return:
Unexplained return = 2:0% − (−3:5%) = 1.5%
10. Although the stock price went down by 2% on the announcement day, the Fama- French model predicted that the price should have gone down by 3.5%. Thus, the stock had a positive 1.5% reaction on the announcement day. This is just one company, but if we repeated this process for many companies that made similar announcements and calculated the average unexplained reaction, we could draw a conclusion regarding the market’s reaction to adding more outside directors. As this example shows, the model is very useful in identifying actions that affect a company’s value.
11. If a company’s sensitivity to the size factor and the B/M factor are related to financial distress risk, then the Fama-French model would be an improvement on the CAPM regarding the relationship between risk and required return. However, the evidence is mixed as to whether financially distressed firms do indeed have higher expected returns as compensation for their risk. In fact, some studies show financially distressed firms actually have lower returns instead of higher returns. A number of other studies suggest that the size effect no longer influences stock returns, that there never was a size effect (the previous results were caused by peculiarities in the data sources), that the size effect doesn’t apply to most companies, and that the book-to-market effect is not as significant as first supposed.
12. In summary, the Fama-French model is very useful in identifying the unexplained component of a stock’s return. However, the model is less useful when it comes to estimating the required return on a stock because the model does not provide a well- accepted link between risk and required return.
Last modified: Tuesday, August 14, 2018, 8:46 AM