Reading: Lesson 2 - Valuing Common, Constant Growth, & Nonconstant Growth Stocks
7.2.A - Valuing Common, Constant Growth, & Non-constant Growth Stocks
1. Valuing Common Stocks
- Common stocks are expected to provide a stream of future cash flows, and a stock’s value is found the same way as the values of other financial assets—namely, as the present value of its expected future cash flow stream. In later sections we will show how to estimate a stock’s value as part of a company’s total value, but we begin here by directly valuing a stock’s cash flows to shareholders.
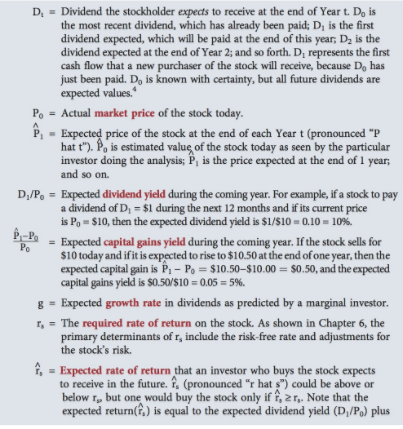
- It’s obvious why an investor needs a stock valuation model, but why does a manager also need a valuation model? A manager should seek to maximize the intrinsic value of her firm’s stock. To do this, a manager needs to know how her actions are likely to affect the stock’s value. In other words, managers need a stock valuation model just as much as investors do. We begin by defining key terms:
- Like all financial assets, the value of a stock is estimated by finding the present value of a stream of expected future cash flows. What are the cash flows that corporations are expected to provide to their stockholders? First, think of yourself as an investor who buys a stock with the intention of holding it (in your family) forever. In this case, all that you (and your heirs) will receive is a stream of dividends, and the value of the stock today is calculated as the present value of an infinite stream of dividends:
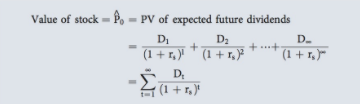
- What about the more typical case, where you expect to hold the stock for a finite period and then sell it—what is the value of P0 in this case? Unless the company is likely to be liquidated or sold and thus to disappear, the value of the stock is again determined by the equation above. To see this, recognize that for any individual investor, the expected cash flows consist of expected dividends plus the expected sale price of the stock. However, the sale price a current investor receives will depend on the dividends some future investor expects. Therefore, for all present and future investors in total, expected cash flows must be based on expected future dividends. Put another way, unless a firm is liquidated or sold to another concern, the cash flows it provides to its stockholders will consist only of a stream of dividends. Therefore, the value of a share of its stock must be the present value of that expected dividend stream.
2. Valuing a Constant Growth Stock
- In the long run, dividends can’t grow faster than earnings. A dollar used to pay dividends can’t be used for reinvestment in the firm or to pay down debt, so everything else equal, higher dividends must be associated either with declining earnings growth due to a lack of reinvestment or with increasing debt levels. Growth in dividends can be supported by increasing debt for a while, but to avoid unacceptably high levels of debt, long-term dividend growth must be limited to long-term earnings growth.
- Long-term earnings per share (EPS) growth depends on economy-wide factors (such as recessions and inflation), industry-wide factors (such as technological innovations), and firm-specific factors (management skill, brand identity, patent protection, etc.). For a firm to grow faster than the economy, either the industry must become a bigger part of the economy or the firm must take market share from its competitors. But as markets mature, competition and market saturation will tend to limit EPS growth to a constant long-term rate, approximately equal to the sum of population growth and inflation.
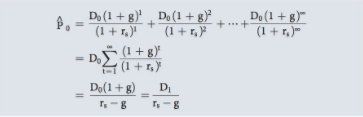
- Some companies are in growing industries and won’t hit their long-term constant growth rate for many years, but some mature firms in saturated industries are already at their constant long-term growth rate. For a mature company whose dividends are growing at a constant rate, the equation above can be rewritten as follows:
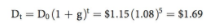
Assume that R&R Enterprises just paid a dividend of $1.15 (that is, D0 = $1.15). Its stock has a required rate of return, rs, of 13.4%, and investors expect the dividend to grow at a constant 8% rate in the future. The estimated dividend 1 year hence would be D1 = $1.15 (1.08) = $1.24; D2 would be $1.34; and the estimated dividend 5 years hence would be $1.69:
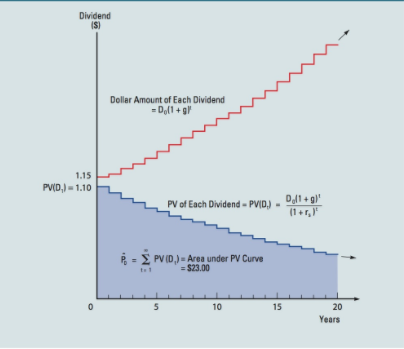
The concept underlying the valuation process for a constant growth stock is graphed in the figure above. Dividends are growing at the rate g = 8%, but because rs > g, the present value of each future dividend is declining. For example, the dividend in Year 1 is D1 = D0(1 + g)1 = $1.15(1.08) = $1.242. However, the present value of this dividend, discounted at 13.4%, is PV(D1) = $1.242/(1.134)1 = $1.095. The dividend expected in Year 2 grows to $1.242(1.08) = $1.341, but the present value of this dividend falls to $1.043. Continuing, D3 = $1.449 and PV(D3) = $0.993, and so on. Thus, the expected dividends are growing, but the present value of each successive dividend is declining, because the dividend growth rate (8%) is less than the rate used for discounting the dividends to the present (13.4%).
If we summed the present values of each future dividend, this summation would be the ^P0 value of the stock, P0. When g is a constant, this summation is equal to D1/(rs − g), as shown in the equation above. Therefore, if we extend the lower step-function curve in the figure above on out to infinity and add up the present values of each future dividend, the summation would be identical to the value given by the equation above, $23.00. Although the equation above assumes there are infinite time periods, most of the value is based on dividends during a finite time period. In our example, 70% of the value is attributed to the first 25 years, 91% to the first 50 years, and 99.4% to the first 100 years. This means that companies don’t have to survive forever to justify using the Gordon growth model.
Managers often complain that the stock market is shortsighted and that investors care only about conditions over the next few years. Let’s use the constant growth model to test this assertion. R&R’s most recent dividend was $1.15, and it is expected to grow at a rate of 8% per year. Because we know the growth rate, we can forecast the dividends for each of the next 5 years and then find their present values:
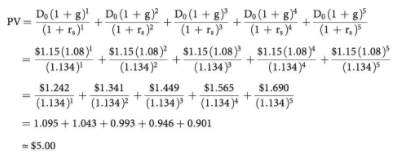
Recall that R&R’s stock price is $23.00. Therefore, only $5.00, or $5/$23 = 0.22 = 22%, of the $23.00 stock price is attributable to short-term cash flows. This means that R&R’s managers will affect the stock price more by working to increase long-term cash flows than by focusing on short-term flows. This situation holds for most companies. Indeed, a number of professors and consulting firms have used actual company data to show that more than 80% of a typical company’s stock price is due to cash flows expected farther than 5 years in the future.
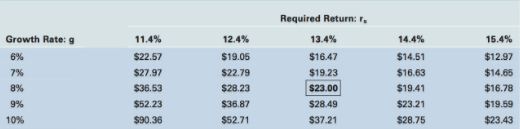
Recall that a typical company’s stock returns are very volatile. Indeed, many stocks declined by 80% or more during 2012, and some enjoyed gains of over 100%. At the risk of understatement, the stock market is volatile. To see why stock prices are volatile, we estimate R&R’s stock value after making small changes to the inputs of the constant growth model, as shown in the Table below. The estimated price is $23 for the original inputs, shown in the boxed cell. Notice that even small changes in the required return or estimated growth rate cause large changes in the estimated stock value.
What might cause investors to change their expectations about the growth rate or risk of future dividends? It could be new information about the company, such as preliminary results for an R&D program, initial sales of a new product, or the discovery of harmful side effects from the use of an existing product. Or new information that will affect many companies could arrive, such as the collapse of the credit markets in 2008. Given the existence of computers and telecommunications networks, new information hits the market on an almost continuous basis, and it causes frequent and sometimes large changes in stock prices. In other words, ready availability of information causes stock prices to be volatile.
If a stock’s price is stable, this probably means that little new information is arriving. But if you think it’s risky to invest in a volatile stock, imagine how risky it would be to invest in a company that rarely releases new information about its sales or operations. It may be bad to see your stock’s price jump around, but it would be a lot worse to see a stable quoted price most of the time and then to see huge moves on the rare days when new information is released. Fortunately, in our economy timely information is readily available, and evidence suggests that stocks—especially those of large companies—adjust rapidly to new information.
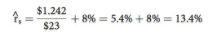
When using the equation above, we first estimated D1 and rs, the required rate of return on the stock; then we solved for the stock’s intrinsic value, which we compared to its actual market price. We can also reverse the process, observing the actual stock price, substituting it into the equation above, and solving for the rate of return. In doing so, we are finding the expected rate of return (recall that if the market is in equilibrium, the ^ expected return will equal the required rate of return, rs = rs):
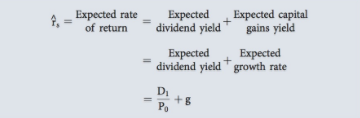
Thus, if you buy a stock for a price P0 = $23, and if you expect the stock to pay a dividend D1 = $1.242 in a year and to grow at a constant rate g = 8% in the future, then your expected rate of return will be 13.4%:
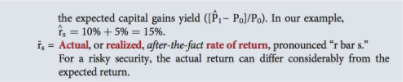
In this form, we see that ^rs is the expected total return and that it consists of an expected dividend yield, D1/P0 = 5.4%, plus an expected growth rate (which is also the expected capital gains yield) of g = 8%.
Suppose that the current price, P0, is equal to $23 and that the Year-1 expected dividend, D1, is equal to $1.242. What is the expected price at the end of the first year, immediately after D1 has been paid? First, we can estimate the expected Year-2 dividend as D2 = D1(1 + g) = $1.242(1.08) = $1.3414. Then we can apply a version of the Equation above that is shifted ahead by 1 year, using D2 instead of D1 and solving for P1 instead of P0:
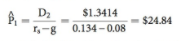
Even easier, notice that P1 must be 8% larger than $23, the price found 1 year earlier for P0:
$23(1.08) = $24.84Either way, we expect a capital gain of $24.84 − $23.00 = $1.84 during the year, which is a capital gains yield of 8%:
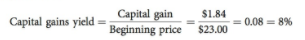
We could extend the analysis, and in each future year the expected capital gains yield would always equal g, the expected dividend growth rate. The dividend yield during the year could be estimated as follows:
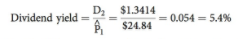
The dividend yield for the following year could also be calculated, and again it would be 5.4%. Thus, for a constant growth stock, the following conditions must hold:
1. The dividend is expected to grow forever at a constant rate, g.
2. The stock price will also grow at this same rate.
3. The expected dividend yield is constant.
4. The expected capital gains yield is also constant and is equal to g, the dividend (and stock price) growth rate.
5. The expected total rate of return, ^rs , is equal to the expected dividend yield plus the expected growth rate: ^rs = dividend yield + g.
3. Valuing Non-constant Growth Stocks
- For many companies, it is not appropriate to assume that dividends will grow at a constant rate. Firms typically go through life cycles. During their early years, their growth is much faster than that of the economy as a whole; then they match the economy’s growth; and finally their growth is slower than that of the economy. Automobile manufacturers in the 1920s, software companies such as Microsoft in the 1990s, and technology firms such as Cisco in the 2000s are examples of firms in the early part of the cycle; these firms are called supernormal, or non-constant, growth firms.
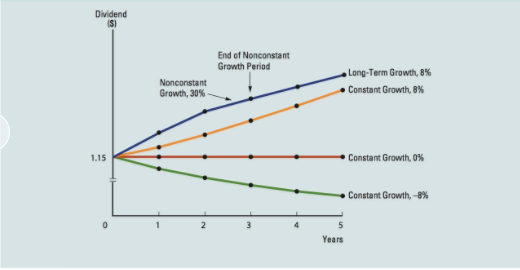
- Suppose R&R, the company from the previous section, was not yet in its constant growth phase but was expected to grow at a 30% rate for the first year, 20% for the second year, 10% for the third year, after which the growth rate is expected to fall to 8% and remain there. The Figure below illustrates this pattern of non-constant growth and also compares it with normal growth, zero growth, and negative growth.
First, we assume that the dividend will grow at nonconstant rates (generally at relatively high rates) for N periods, after which it will grow at a constant rate, gL. Often N is called the horizon date or the terminal date.
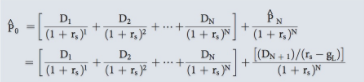
Recall that a stock’s current estimated value, P0, is the present value of all dividends ^ after Time 0, discounted back to Time 0. Similarly, the estimated value of a stock at Time N is the present value of all dividends beyond Time N, discounted back to Time N. When dividends beyond Time N are expected to grow at a constant long-term rate of gL, we can use a variation of the constant growth formula, the Equation above, to estimate the stock’s intrinsic value at Time N. The estimated value at Time N is often called the horizon value or the terminal value. For stocks, ^PN, denotes the horizon value of the expected stock price at Time N:

A stock’s estimated value today, P0, is the present value of the dividends during the non-constant growth period plus the present value of the dividends after the horizon date:
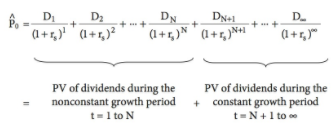
Horizon value is the value of all dividends beyond Time N discounted back to Time N. Discounting the horizon value from Time N to Time 0 provides an estimate of the present value of all dividends beyond the non-constant growth period. Thus, the stock’s current estimated value is the present value of all dividends during the non-constant growth period plus the present value of the horizon value:
To implement the Equation above, we go through the following three steps.
1. Estimate the expected dividends for each year during the period of non-constant growth.
2. Find the expected price of the stock at the end of the non-constant growth period, at which point it has become a constant growth stock.
3. Find the present values of the expected dividends during the non-constant growth period and the present value of the expected stock price at the end of the non-constant ^ growth period. Their sum is the estimated value of the stock, P0.
Last modified: Tuesday, August 14, 2018, 8:48 AM