Reading: Lesson 3 - The Free Cash Flow Valuation Model
7.3.A - The Free Cash Flow Valuation Model
1. The Free Cash Flow Valuation Model
- As stated earlier, managers should estimate and evaluate the impact of alternative strategies on their firms’ values, which means that managers need a valuation model. The dividend growth model provides many meaningful insights, such as (1) the relative importance of long-term cash flows versus short-term cash flows and (2) the reason stock prices are so volatile. However, the dividend growth model is unsuitable in many situations.
- For example, suppose a start-up company is formed to develop and market a new product. Its managers will focus on product development, marketing, and raising capital. They will probably be thinking about an eventual IPO, or perhaps the sale of the company to a larger firm; for example, Google, Cisco, Microsoft, Intel, IBM, or another of the industry leaders buy hundreds of successful new companies each year. For the managers of such a start-up, the decision to initiate dividend payments in the foreseeable future will be totally off the radar screen. Thus, the dividend growth model is not useful for valuing most start-up companies.
- Also, many established firms pay no dividends. Investors may expect them to pay dividends sometime in the future—but when, and how much? As long as internal opportunities and acquisitions are so attractive, the initiation of dividends will be postponed, and this makes the dividend growth model of little use. Even Apple, one of the world’s most successful companies, paid no dividends from 1995 until 2012, when it initiated quarterly dividend payments.
- Finally, the dividend growth model is generally of limited use for internal management purposes, even for a dividend-paying company. If the firm consisted of just one big asset and if that asset produced all of the cash flows used to pay dividends, then alternative strategies could be judged through the use of the dividend growth model. However, most firms have several different divisions with many assets, so the corporation’s value depends on the cash flows from many different assets and on the actions of many managers. These managers need a way to measure the effects of their decisions on corporate value, but the discounted dividend model isn’t very useful because individual divisions don’t pay dividends.
- Fortunately, the free cash flow valuation model does not depend on dividends, and it can be applied to divisions and sub-units as well as to the entire firm.
2. Sources of Value and Claims on Value
- Companies have two primary sources of value, the value of operations and the value of non-operating assets. There are three major types of claims on this value: debt, preferred stock, and common stock.
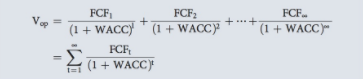
- Recall that free cash flow (FCF) is the cash flow available for distribution to all of a company’s investors. The weighted average cost of capital (WACC) is the overall return required by all of a company’s investors. Because FCF is generated by a company’s operations, the present value of expected FCF when discounted by the WACC is equal to the value of a company’s operations, Vop:
The primary source of value for most companies is the value of operations. A secondary source of value comes from non-operating assets (also called financial assets). There are two major types of non-operating assets: (1) marketable securities, which are short-term securities (like T-bills) that are over and above the amount of cash needed to operate the business; (2) other non-operating assets, which often are investments in other businesses. For example, Ford Motor Company’s automotive operation held about $14.2 billion in marketable securities at the end of December 2010, and this was in addition to $6.3 billion in cash. Second, Ford also had $2.4 billion of investments in other businesses, which were reported on the asset side of the balance sheet as “Equity in Net Assets of Affiliated Companies.” In total, Ford had $14.2 + $2.4 = $16.6 billion of non-operating assets, amounting to 26% of its $64.6 billion of total automotive assets. For most companies, the percentage is much lower. For example, as of the end of October 2010, Walmart’s percentage of non-operating assets was less than 1%, which is more typical.
For a company that is a going concern, debtholders have the first claim on value in the sense that interest and scheduled principal payments must be paid before any preferred or common dividends can be paid. Preferred stockholders have the next claim because preferred dividends must be paid before common dividends. Common shareholders come last in this pecking order and have a residual claim on the company’s value.
3. Estimating the Value of Operations
- The free cash flow (FCF) model is analogous to the dividend growth model, except the FCF valuation model (1) discounts free cash flows instead of dividends and (2) the discount rate is the weighted average cost of capital (WACC) instead of the required return on stock. Free cash flow is generated by operations, FCF is the cash flow available for all investors, and the WACC is the overall required return of all investors; therefore, the result of the FCF model is the total value of operations, not just the value of the stock.
- We will illustrate the FCF valuation model using MagnaVision Inc., which produces optical systems for use in medical photography. Growth has been rapid in the past, but the market is becoming saturated, so the sales growth rate is projected to decline from 21% in 2013 to a sustainable rate of 5% in 2016 and beyond. Profit margins are expected to improve as the production process becomes more efficient and because MagnaVision will no longer be incurring marketing costs associated with the introduction of a major product. All items on the financial statements are projected to grow at a 5% rate after 2016.
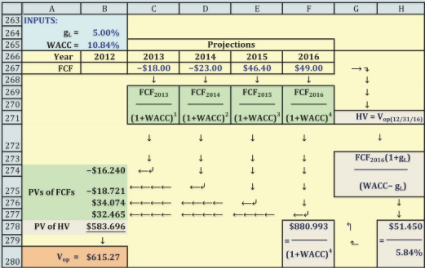
- Early we explained how to calculate FCF if you have historical financial statements; however, you need forecasted financial statements to apply the FCF valuation model. To better focus on the free cash flow valuation model in this example, we provide MagnaVision’s projected free cash flows in Figure below and defer forecasting until Chapter 12.8 We also provide MagnaVision’s weighted average cost of capital, 10.84%.
- Notice that MagnaVision has negative free cash flows in the first two projected years. Negative free cash flow in early years is typical for young, high-growth companies. Even though net operating profit after taxes (NOPAT) may be positive, free cash flow often is negative due to investments in operating assets during the high-growth years. As growth slows, free cash flow will become positive and eventually grow at a constant rate.
To estimate MagnaVision’s value of operations, we use an approach similar to the non-constant dividend growth model for stocks and proceed as follows.
1. Recognize that growth after Year N will be constant, so we can use a constant growth formula to find the firm’s value at Year N. The value at Year N is the sum of the PVs of FCF for year N + 1 and all subsequent years, discounted back to Year N.
2. Find the PV of the free cash flows for each of the N non-constant growth years. Also, find the PV of the firm’s value at Year N.
3. Now sum all the PVs, those of the annual free cash flows during the non-constant period plus the PV of the Year-N value, to find the firm’s value of operations.
A variant of the constant growth dividend model, in which FCF replaces dividends and the WACC replaces rs. This equation can be used to find the value of MagnaVision’s operations at time N, when its free cash flows stabilize and begin to grow at a constant rate. This is the value of all FCFs beyond time N, discounted back to time N (which is 2016 for MagnaVision):
Based on a 10.84% cost of capital, $49 million of free cash flow in 2016, and a 5% growth rate, the value of MagnaVision’s operations as of December 31, 2016, is estimated to be $880.99 million:
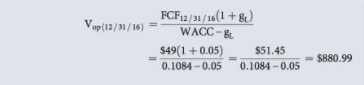
This $880.99 million figure is called the company’s horizon value because it is the value at the end of the forecast period. It is also sometimes called a continuing value or terminal value. It is the amount that MagnaVision could expect to receive if it sold its operating assets on December 31, 2016.
The Figure above shows the free cash flow for each year during the non-constant growth period along with the horizon value of operations in 2016. To find the value of operations as of “today,” December 31, 2012, we find the PV of the horizon value and each annual free cash flow in the Figure below, discounting at the 10.84% cost of capital:
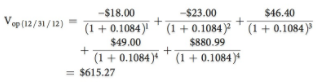
The sum of the PVs is approximately $615 million, and it represents an estimate of the price MagnaVision could expect to receive if it sold its operating assets “today,” December 31, 2012.
4. Estimating the Price per Share
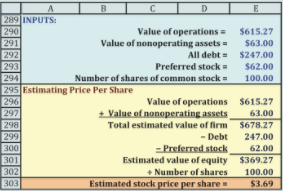
- In addition to the value of operations, we need to know the value of MagnaVision’s non-operating assets, claims on value (such as debt and preferred stock), and the number of shares. Those values are shown in the INPUTS section of the Figure below.
- Think of a company’s value as though it were a pie whose size is determined by the value of operations and the value of any financial (non-operating) assets. The first piece of pie belongs to debtholders, the second to preferred stockholders, and the remaining piece (if there is one) to common shareholders. In other words, common shareholders have a residual claim.
- On December 31, 2012, MagnaVision reported owning $63 million of marketable securities. We don’t need to calculate a present value for marketable securities because short-term financial assets as reported on the balance sheet are at (or close to) their market value. Therefore, MagnaVision’s total value on December 31, 2012, is $615.27 + $63 = $678.27 million.
- The value of common equity is the remaining value after other claims. The Figure below shows that MagnaVision has $247 million in debt and $62 million in preferred stock. Therefore, the value left for common stockholders is $678.27 − $247 − $62 = $369.27 million.
5. Comparing the Free Cash Flow Valuation and Dividend Growth Models
- The free cash flow valuation model and the dividend growth model give the same estimated stock price if you are very careful to be consistent with the implicit assumptions underlying the projections of free cash flows and dividends. Which model should you use, as they both give the same answer? If you were a financial analyst estimating the value of a mature company whose dividends are expected to grow steadily in the future, it would probably be more efficient to use the dividend growth model. In this case you would need to estimate only the growth rate in dividends, not the entire set of forecasted financial statements.
- However, if a company is paying a dividend but is still in the high-growth stage of its life cycle, you would need to project the future financial statements before you could make a reasonable estimate of future dividends. After you have estimated future financial statements, it would be a toss-up as to whether the corporate valuation model or the dividend growth model would be easier to apply. If you were trying to estimate the value of a company that has never paid a dividend, a private company (including companies nearing an IPO), or a division of a company, then there would be no choice: You would have to estimate future financial statements and use the corporate valuation model.
Last modified: Tuesday, August 14, 2018, 8:49 AM