Reading: Lesson 3 - Cost of Preferred & Common Stock
8.3.A - Cost of Preferred & Common Stock
1. Cost of Preferred Stock
- Many firms (including MicroDrive) use, or plan to use, preferred stock as part of their financing mix. Preferred dividends are not tax deductible, so the company bears their full cost. Therefore, no tax adjustment is used when calculating the cost of preferred stock. Some preferred stocks are issued without a stated maturity date, but today most have a sinking fund that effectively limits their life. Finally, although it is not mandatory that preferred dividends be paid, firms generally have every intention of doing so, because otherwise (1) they cannot pay dividends on their common stock, (2) they will find it difficult to raise additional funds in the capital markets, and (3) in some cases preferred stockholders can take control of the firm.
- The component cost of preferred stock, rps, is the cost used in the WACC calculation. For preferred stock with a stated maturity date, we use the same approach as in the previous section for the cost of debt, keeping in mind that a firm has no tax savings with preferred stock. For preferred stock without a stated maturity date, rps is:

Here Dps is the preferred dividend, Pps is the preferred stock price, and F is the flotation cost as a percentage of proceeds. To illustrate the calculation, assume MicroDrive has preferred stock that pays an $8 dividend per share and sells for $100 per share. If MicroDrive issued new shares of preferred, then it would incur an underwriting (or flotation) cost of 2.5%, or $2.50 per share, so it would net $97.50 per share. Therefore, MicroDrive’s cost of preferred stock is 8.2%:
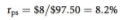
If we had not incorporated flotation costs, we would have incorrectly estimated rps = $8/$100 = 8.0%, which is too big a difference to ignore. Therefore, analysts usually include flotation costs when estimating the firm’s cost of preferred stock.
Although preferred stock is riskier than debt, MicroDrive’s preferred stock has a lower return to investors than does its debt: 8% versus 9%. However, recall that most preferred stock is held by other companies, which are allowed to exclude 70% of preferred stocks’ dividends from taxation. Thus, the after-tax return to these investors is higher for preferred stock than for debt, which is consistent with preferred stock being riskier than debt.
2. Cost of Common Stock
- Before addressing the required return for an individual stock, let’s start with the big picture, which is the required return for the entire stock market. In other words, how much return do investors require to induce them to invest in stocks? It often is more convenient to focus on the extra return that investors require to induce them to invest in risky equities over and beyond the return on a Treasury bond. As explained in earlier sections, this extra return is called the market risk premium, RPM. Sometimes this is called the equity risk premium, or just the equity premium.
- Unfortunately, the required return on the market, and hence the equity premium, is not directly observable. Three approaches may be used to estimate the market risk premium: (1) calculate historical premiums and use them to estimate the current premium; (2) survey experts; and (3) use the current value of the market to estimate forward-looking premiums. Following are descriptions of each approach.
- Historical risk premium data for U.S. securities, updated annually, are available from many sources, including Ibbotson Associates. Using data from 1926 through the most recent year, Ibbotson calculates the actual realized rate of return each year for the stock market and for long-term government bonds. Ibbotson defines the annual equity risk premium as the difference between the historical realized returns on stocks and the historical yields to maturity on long-term T-bonds. Ibbotson recently reported a 6.6% arithmetic average historical risk premium. How should these data be used?
- First, stock returns are quite volatile, which leads to low statistical confidence in estimated averages. For example, the estimated historical average premium is 6.6%, but based on the market return’s standard deviation of around 20%, the 95% confidence interval ranges about plus or minus 3% from 6.6%. In other words, the historical average is helpful in deciding whether the risk premium is on the order of 6% or 20%, but it isn’t very helpful in deciding whether the premium should be 4% or 6%.
- Second, the historical average is extremely sensitive to the period over which it is calculated. For this period, the estimated historic risk premium is just 3.9%.
- Third, changes in the risk premium can occur if investors’ tolerance for risk changes. This causes problems in interpreting historical returns because a change in the required risk premium causes an opposite change in the observed premium. For example, an increase in the required premium means that investors have become more risk averse and require a higher return on stocks. But applying a higher discount rate to a stock’s future cash flows causes a decline in stock price. Thus, an increase in the required premium causes a simultaneous decrease in the observed premium. Part of the market’s precipitous decline in 2008 and 2009 surely was due to investors’ increased risk aversion.
- An alternative to the historical risk premium is the forward-looking, or ex ante, risk premium. As explained earlier, if we assume that the market dividend will grow at a constant rate and that the firms that make up the market pay out as dividends all the funds available for distribution (i.e., the firms make no stock repurchases or purchases of short-term investments), then the expected market rate of return, r^M is:

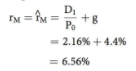
If we also assume that the market is in equilibrium, then required return on the market, rM, is equal to the expected return, r^M, found by using the Equation above. Thus, the required return on the market can be estimated as the sum of the market’s expected dividend yield plus the expected constant growth rate in dividends.
Following is an illustration for how to use the Equation above to estimate the required return on the market. First, you need an estimate of the expected dividend. In April 2012, Standard & Poor’s Web site reported a projected dividend yield of 2.16% for the S&P 500, based on declared dividends. Second, you need an estimate of the constant dividend growth rate, g. One approach is to use the historical average growth rate in dividends for the S&P 500, which is about 4.4% (for 1926–2011). Using these estimates produces an estimate of the required market return:
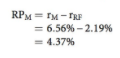
At the time we estimated rM, the 10-year T-bond yield was 2.19%. Using the previously estimated rM of 6.56%, the estimated forward-looking market risk premium is:
3. Market Risk Premium
- After reading the previous sections, you might well be confused about the best way to estimate the market risk premium. Here’s our opinion: The risk premium is driven primarily by investors’ attitudes toward risk, and there are good reasons to believe that investors’ risk aversion changes over time. The introduction of pension plans, Social Security, health insurance, and disability insurance over the last 50 years means that people today can take more chances with their investments, which should make them less risk averse. Moreover, many households have dual earners, allowing households to take more chances. Therefore, the risk premium is lower now than it was 50 years ago.
- Use a risk premium of about 5% to 6%, but it would be tough to argue with someone who used a risk premium anywhere in the range of 3% to 7%. Investors’ aversion to risk is relatively stable much of the time, but it is not absolutely constant from year to year and is certainly not constant during periods of great stress, such as during the 2008–2009 financial crisis. When stock prices are relatively high, investors feel less risk averse, so using a risk premium at the low end of our range. Conversely, when prices are depressed, use a premium at the high end of the range. The bottom line is that there is no way to prove that a particular risk premium is either right or wrong, though being suspicious of an estimated market premium that is less than 3% or greater than 7%.
Last modified: Tuesday, August 14, 2018, 8:50 AM