Reading: Lesson 5 - Dividend Yield Plus Growth Rate & Discounted Cash Flow Approach
8.5.A - Dividend Yield Plus Growth Rate & Discounted Cash Flow Approach
1. Dividend-Yield-Plus-Growth-Rate
- In Unit 7, we saw that if an investor expects dividends to grow at a constant rate and if the company makes all payouts in the form of dividends (the company does not repurchase stock), then the price of a stock can be found as follows:
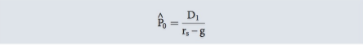
Here ^P0 is the intrinsic value of the stock for the investor, D1 is the dividend expected to be paid at the end of Year 1, g is the expected growth rate in dividends, and rs is the required rate of return. For the marginal investor, the required return is equal to the expected return. If this investor is the marginal investor then ^P0 = P0, the market price of the stock, and we can solve for rs to obtain the required rate of return on common equity:
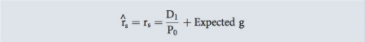
Thus, investors expect to receive a dividend yield, D1/P0, plus a capital gain, g, for a total expected return of ^r. In equilibrium this expected return is also equal to the required s return, rs. This method of estimating the cost of equity is called the discounted cash flow, or DCF, method. Henceforth, we will assume that markets are at equilibrium (which means that rs = ^rs), and this permits us to use the terms rs and ^rs interchangeably.
2. Estimating Inputs for the DCF Approach
- Three inputs are required to use the DCF approach: the current stock price, the current dividend, and the marginal investor’s expected dividend growth rate. The stock price and the dividend are easy to obtain, but the expected growth rate is difficult to estimate.
- If earnings and dividend growth rates have been relatively stable in the past, and if investors expect these trends to continue, then the past realized growth rate may be used as an estimate of the expected future growth rate. Unfortunately, such situations occur only at a handful of very mature, slow-growing companies, which precludes the usefulness of historical growth rates as predictors of future growth rates for most companies.
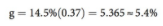
- Most firms pay out some of their net income as dividends and reinvest, or retain, the rest. The more they retain, and the higher the earned rate of return on those retained earnings, the larger their growth rate. This is the idea behind the retention growth model. The payout ratio is the percent of net income that the firm pays out in dividends, and the retention ratio is the complement of the payout ratio: Retention ratio = (1 − Payout ratio). To illustrate, consider Aldabra Corporation, a mature company. Aldabra’s payout ratio has averaged 63% over the past 15 years, so its retention rate has averaged 1.0 − 0.63 = 0.37 = 37%. Also, Aldabra’s return on equity (ROE) has averaged 14.5% over the past 15 years. We know that, other things held constant, the earnings growth rate depends on the amount of income the firm retains and the rate of return it earns on those retained earnings, and the retention growth equation can be expressed as follows:

Using Aldabra’s 14.5% average ROE and its 37% retention rate, we can use the Equation above to find the estimated g:
Although easy to implement, this approach requires four major assumptions: (1) the payout rate, and thus the retention rate, remain constant; (2) the ROE on new investments remains constant and equal to the ROE on existing assets; (3) the firm is not expected to repurchase or issue new common stock, or, if it does, this new stock will be sold at a price equal to its book value; and (4) future projects are expected to have the same degree of risk as the firm’s existing assets. Unfortunately, these assumptions apply in very few situations, limiting the usefulness of the retention growth model.
A third technique calls for using security analysts’ forecasts. As we discussed earlier, analysts publish earnings’ growth rate estimates for most of the larger publicly owned companies. For example, Value Line provides such dividend forecasts on about 1,700 companies. Several sources compile analysts’ earnings forecasts on a regular basis, and these earnings growth rates can be used as proxies for dividend growth rates.
3. An Illustration of the DCF Approach
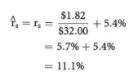
- To illustrate the DCF approach, suppose Aldabra’s stock sells for $32, its next expected dividend is $1.82, and its expected constant growth rate is 5.4%. Aldabra is not expected to repurchase any stock. Aldabra’s stock is thought to be in equilibrium, so its expected and required rates of return are equal. Based on these assumptions, its estimated DCF cost of common equity is 11.1%:
As previously noted, it is difficult to apply the DCF approach because dividends do not grow at a constant rate for most companies. Surveys show that 16% of responding firms use the DCF approach, down from 31% in 1982.
Остання зміна: вівторок 14 серпня 2018 08:50 AM