Reading: Lesson 2 - Internal Rate of Return & Modified Internal Rate of Return
9.2.A - Internal Rate of Return & Modified Internal Rate of Return
1. Internal Rate of Return (IRR)
- In Unit 5 we discussed the yield to maturity on a bond, and we explained that if you hold a bond to maturity then you will earn the yield to maturity on your investment. The YTM is found as the discount rate that forces the present value of the cash inflows to equal the price of the bond. This same concept is used in capital budgeting when we calculate a project’s internal rate of return, or IRR. A project’s IRR is the discount rate that forces the PV of the expected future cash flows to equal the initial cash flow. This is equivalent to forcing the NPV to equal zero.
- Why is the discount rate that causes a project’s NPV to equal zero helpful as an evaluation measure? The reason is that the IRR is an estimate of the project’s rate of return. If this return exceeds the cost of the funds used to finance the project, then the difference benefits the firm’s stockholders. On the other hand, if the IRR is less than the cost of capital, stockholders must make up the shortfall.
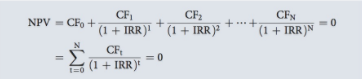
- To calculate the IRR, begin with the NPV Equation, replace r in the denominator with the term “IRR,” and choose a value of r so that the NPV is equal to zero. This transforms the NPV Equation into the Equation below, the one used to find the IRR. The rate that forces NPV to equal zero is the IRR.
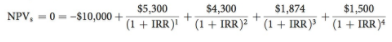
For Project S, we have
Three procedures can be used to find the IRR:
1. Trial-and-error. We could use a trial-and-error procedure: Try a discount rate, see if the equation solves to zero, and if it doesn’t, try a different rate. Continue until you find the rate that forces the NPV to zero, and that rate will be the IRR. This procedure is rarely done by hand calculations, however. IRR usually is calculated using either a financial calculator or Excel (or some other computer program) as described below.
2. Calculator solution. Enter the cash flows into the calculator’s cash flow register just as you did to find the NPV, and then press the calculator key labeled “IRR.” Instantly, you get the internal rate of return. Here are the values for Projects S and L: IRRS 1⁄4 14:686% IRRL 1⁄4 13:786%
3. Excel solution. It is even easier to find IRRs using Excel, as the Figure below shows for Project L. Notice that with Excel’s IRR function, the range in the function includes the initial cash flow at Year 0. This is in contrast to the NPV function’s range, which starts with the Year 1 cash flow. Be alert to this difference when you use these functions, because it is easy to mis-specify the range of inputs.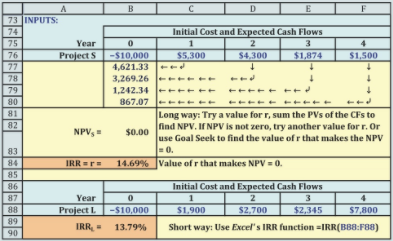
2. A Potential Problem with the IRR: Multiple Internal Rates of Return
- If a project has a normal cash flow pattern, which is one or more cash outflows followed only by cash inflows (or the reverse, one or more cash inflows followed only by outflows), then the project can have only one positive real IRR. Here are some examples of normal cash flow patterns:
Normal: −+++ or −− +++ or ++−− - Notice that the sign of the cash flows only changes once for any of these examples, either from negative to positive or positive to negative.
- However, some projects have cash flows with signs that change more than once. For example, consider a strip coal mine where the company first spends money to buy the property and prepare the site for mining. The mining company has positive inflows for several years, and then spends more money to return the land to its original condition. For this project, the cash flow sign goes from negative to positive and then changes again from positive to negative. This is a nonnormal cash flow pattern; here are some examples:
Nonnormal: −++++− or −+++−+++ - If a project’s cash flows have a nonnormal pattern (i.e., the cash flows have more than one sign change), it is possible for the project to have more than one positive real IRR—that is, multiple IRRs.
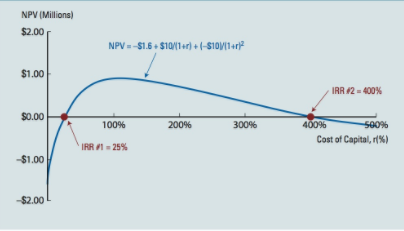
- To illustrate multiple IRRs, suppose a firm is considering a potential strip mine (Project M) that has a cost of $1.6 million and will produce a cash flow of $10 million at the end of Year 1; however, the firm must spend $10 million to restore the land to its original condition at the end of Year 2. Therefore, the project’s expected net cash flows are as follows (in millions):
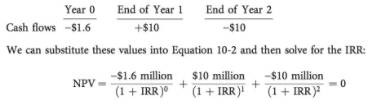
For Project M’s cash flows, the NPV equals 0 when IRR = 25%, but it also equals 0 when IRR = 400%.7 Therefore, Project M has one IRR of 25% and another of 400%. Are either of these IRRs helpful in deciding whether to proceed with Project M? No. To see this, look at the Figure below, which shows Project M’s NPV for different costs of capital. Notice that Project M has a negative NPV for costs of capital less than 25%. Therefore, Project M should be rejected for reasonable costs of capital.
3. Potential Problems When Using the IRR to Evaluate Mutually Exclusive Projects
- Potential problems can arise when using the IRR to choose among mutually exclusive projects. Projects S and L are independent, but suppose for illustrative purposes that they are mutually exclusive. Their NPVs and IRRs are shown below:
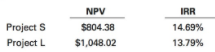
If using NPV as a decision criterion, Project L is preferred. But Project S is preferred if using IRR as a decision criterion. How do we resolve this conflict?
Consider these two hypothetical games we offer our students in class. In Game 1, we offer to give a student $2 at the end of class if the student will give us $1 at the beginning. Assuming we can be trusted, Game 1 has a 100% rate of return. In Game 2, we offer to give a student $25 at the end of class in exchange for $20 at the beginning of class. The games are mutually exclusive and may not be repeated—a student can choose only one game and can play it only once. Which game would you choose? If you are like our students, you would choose Game 2 because your wealth goes up by $5, which is better than the $1 increase in wealth offered by Game 1. So even though Game 1 has a higher rate of return, people prefer more wealth to less wealth.
The same is true for the shareholders. If projects are mutually exclusive, managers should choose the project that provides the greatest increase in wealth (as measured by the NPV) even though it may not have the highest rate of return (as measured by the IRR). Therefore, if Projects S and L were mutually exclusive, managers would choose Project L because it has a higher NPV and generates more wealth for shareholders.
The Figure below illustrates the situation with a net present value profile for each project. This profile has a project’s NPV plotted on the y-axis for different costs of capital. Notice the IRR for each project, which is the point at which the project has a zero NPV (it is also the place where the curve crosses the x-axis). As the figure shows, Project S has the largest IRR (the curve for Project S crosses the x-axis to the right of Project L’s curve). Notice the NPV for each project when the cost of capital is 10%. Project L’s NPV is above that of Project S.
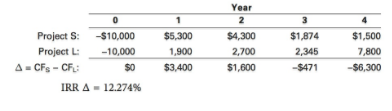
The two NPV profile lines cross at a cost of capital of 12.247%, which is called the crossover rate. Find the crossover rate by calculating the IRR of the differences in the projects’ cash flows, as demonstrated below:
If the cost of capital is less than the crossover rate, Project L has the higher NPV. But if the cost of capital is greater than the crossover rate, Project S has the higher NPV.
Many projects don’t have different rankings—if a project has a larger NPV, it usually has a higher IRR. But for projects whose rankings conflict, you must determine the source of the conflict. Note that in order for a conflict to exist, both projects must have positive NPVs and there must be a crossover rate. For a crossover rate to exist, the difference in cash flows between the two projects must have a normal pattern, as described in the previous section: The cash flows must have one and only one sign change. Therefore, a crossover rate only can exist for projects with positive NPVs if the cash flows have timing differences, size (or scale) differences, or some combination.8 For example, consider the cash flows of Project Sooner and Project Later. Both have a 10% cost of capital; their cash flows are shown below:
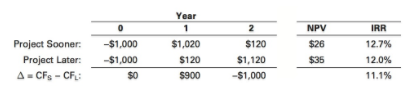
Both projects have the same scale (each requires an initial investment of $1,000), so the difference in their initial cost is zero. However, Project Sooner has most of its future cash flows in Year 1 and Project Later has most of its future cash flows in Year 2. This causes their difference in Year 1 to be positive and their difference in Year 2 to be negative. In other words, there is one and only one sign change, so a crossover rate exists. As this illustrates, projects with the same scale must have timing differences in future cash flows for there to be one and only one sign change. What about a situation in which projects don’t have timing differences but do have a scale difference? Projects Smaller and Larger each have a 10% cost of capital, and their cash flows are shown below:
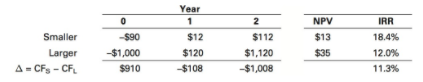
There are no timing differences in the future cash flows; in fact, Project Smaller’s future cash flows are 10% of Project Larger’s. However, there is a scale difference because Project Smaller’s initial cost is much less than that of Project Larger. The scale difference causes the difference in the initial cash flow to be positive. However, the differences in the future cash flows are negative. This causes one and only one sign change, so a crossover rate exists.
4. Applying IRR as an Evaluation Measure
- When using the IRR, it is important to distinguish between independent projects and mutually exclusive projects.
- If you are evaluating an independent project with normal cash flows, then the NPV and IRR criteria always lead to the same accept/reject decision: If NPV says accept then IRR also says accept, and vice versa. To see why this is so, look at Figure above and notice (1) that the IRR says accept Project S if the cost of capital is less than (or to the left of) the IRR and (2) that if the cost of capital is less than the IRR, then the NPV must be positive. Thus, at any cost of capital less than 14.686%, Project S will be recommended by both the NPV and IRR criteria, but both methods reject the project if the cost of capital is greater than 14.686%. A similar statement can be made for Project L, or any other normal project, and we would always reach the same conclusion: For normal, independent projects, if the IRR says to accept it, then so will the NPV.
- Now assume that Projects S and L are mutually exclusive rather than independent. Therefore, we can choose either S or L, or we can reject both, but we can’t accept both.
• IRRS > IRRL, so the IRR decision rule would say to accept Project S over Project L.
• As long as the cost of capital is greater than the crossover rate of 12.274%, both methods agree that Project S is better: NPVS > NPVL and IRRS > IRRL. Therefore, if r is greater than the crossover rate, no conflict occurs. - However, if the cost of capital is less than the crossover rate, a conflict arises: NPV ranks L higher, but IRR ranks S higher. In this situation, select the project with the highest NPV even if it has a lower IRR.
5. Modified Internal Rate of Return (MIRR)
- Recall from Section 5 that an investor who purchases a bond and holds it to maturity (assuming no default) will receive the bond’s yield to maturity (YTM) even if interest rates change. This happens because the realized rate of return on an investment is by definition the rate that sets the present value of the realized cash flows equal to the purchase price. However, the realized rate of return on the investment in the bond and the subsequent reinvestment of the coupons will not necessarily equal the YTM if interest rates change. Similar reasoning can be applied to a project—the project’s expected return is equal to its IRR, but the expected return on the project and any reinvested cash flows is not necessarily equal to the IRR.
- If a manager wishes to evaluate a project based on the return expected from the project and its reinvested cash flows, then the IRR overstates this return because it is more likely that the project’s future cash flows can be reinvested at the cost of capital and not at the project’s IRR. The Modified IRR (MIRR) is similar to the regular IRR, except it is based on the assumption that cash flows are reinvested at the WACC (or some other explicit rate if that is a more reasonable assumption). Refer to the Figure below as you read the following steps that explain the MIRR’s calculation.
1. Project S has just one outflow, a negative $10,000 at t = 0. Because it occurs at Time 0, it is not discounted, and its PV is −$10,000. If the project had additional outflows, we would find the PV at t = 0 for each one and then sum them for use in the MIRR calculation.
2. Next, we find the future value of each inflow, compounded at the WACC out to the “terminal year,” which is the year the last inflow is received. We assume that cash flows are reinvested at the WACC. For Project S, the first cash flow, $5,300, is compounded at WACC = 10% for 3 years, and it grows to $7,054. The second inflow, $4,300, grows to $5,203, and the third inflow, $1,874, grows to $2,061. The last inflow, $1,500, is received at the end, so it is not compounded at all. The sum of the future values, $15,819, is called the “terminal value,” or TV.
3. We now have the PV at t = 0 of all negative cash flows, −$10,000, and the TV at Year 4 of all positive cash flows, $15,819. There is some discount rate that will cause the PV of the terminal value to equal the cost. That interest rate is defined as the Modified Internal Rate of Return (MIRR). In a calculator, enter N = 4, PV = −10000, PMT = 0, and FV = 15819. Then pressing the I/YR key yields the MIRR, 12.15%.
4. The MIRR can be found in a number of ways. Figure below illustrates how the MIRR is calculated: We compound each cash inflow, sum them to determine the TV, and then find the rate that causes the PV of the TV to equal the cost. That rate in this example is 12.15%. However, Excel and some of the better calculators have a built-in MIRR function that streamlines the process.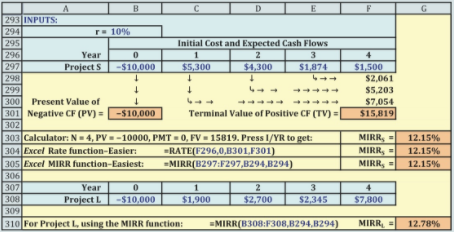
- The MIRR has two significant advantages over the regular IRR. First, the MIRR assumes that cash flows are reinvested at the cost of capital (or some other explicit rate). Because reinvestment at the IRR is generally not correct, the MIRR is usually a better indicator of the rate of return on the project and its reinvested cash flows. Second, the MIRR eliminates the multiple IRR problem—there can never be more than one MIRR, and it can be compared with the cost of capital when deciding to accept or reject projects.
- Our conclusion is that the MIRR is better than the regular IRR; however, this question remains: Is MIRR as good as the NPV? Here is our take on the situation.
• For independent projects, the NPV, IRR, and MIRR always reach the same accept– reject conclusion, o the three criteria are equally good when evaluating independent projects.
• However, if projects are mutually exclusive and if they differ in size, conflicts can arise. In such cases the NPV is best because it selects the project that maximizes value.10
• Our overall conclusions are that (1) the MIRR is superior to the regular IRR as an indicator of a project’s “true” rate of return, but (2) NPV is better than either IRR or MIRR when choosing among competing projects. If managers want to know the expected rates of return on projects, it would be better to give them MIRRs than IRRs because MIRRs are more likely to be the rates that are actually earned if the projects’ cash flows are reinvested in future projects.
Last modified: Tuesday, August 14, 2018, 8:51 AM