Reading: Lesson 3 - Profitability Index & Payback Period
9.3.A - Profitability Index & Payback Period
1. Profitability Index (PI)
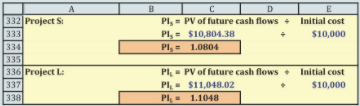
- Here CFt represents the expected future cash flows and CF0 represents the initial cost. The PI shows the relative profitability of any project, or the present value per dollar of initial cost. As we can see from Figure below, the PI for Project S, based on a 10% cost of capital, is $10,804.38/$10,000 = 1.0804; the PI for Project L is 1.1048. Thus, Project S is expected to produce $1.0804 of present value for each $1 of investment whereas L should produce $1.1048 for each dollar invested.

A project is acceptable if its PI is greater than 1.0, and the higher the PI, the higher the project’s ranking. Therefore, both S and L would be accepted by the PI criterion if they were independent, and L would be ranked ahead of S if they were mutually exclusive.
Mathematically, the NPV, IRR, MIRR, and PI methods will always lead to the same accept/reject decisions for normal, independent projects: If a project’s NPV is positive, its IRR and MIRR will always exceed r and its PI will always be greater than 1.0. However, these methods can give conflicting rankings for mutually exclusive projects if the projects differ in size or in the timing of cash flows. If the PI ranking conflicts with the NPV, then the NPV ranking should be used.
2. Payback Period
- NPV and IRR are the most commonly used methods today, but historically the first selection criterion was the payback period, defined as the number of years required to recover the funds invested in a project from its operating cash flows. The Equation below is used for the calculation, and the process is diagrammed in the Figure below. We start with the project’s cost, a negative number, and then add the cash inflow for each year until the cumulative cash flow turns positive. The payback year is the year prior to full recovery, plus a fraction equal to the shortfall at the end of the prior year divided by the cash flow during the year when full recovery occurs:

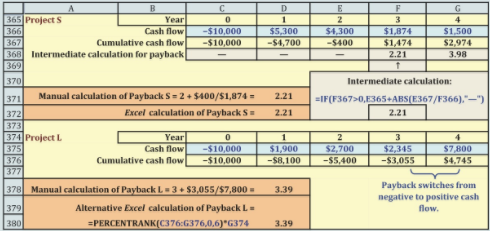
The cash flows for Projects S and L, together with their paybacks, are shown in the Figure above. The shorter the payback, the better the project. Therefore, if the firm requires a payback of 3 years or less, then S would be accepted but L would be rejected. If the projects were mutually exclusive, S would be ranked over L because of its shorter payback.
The regular payback has three flaws: (1) Dollars received in different years are all given the same weight—that is, the time value of money is ignored. (2) Cash flows beyond the payback year are given no consideration whatsoever, regardless of how large they might be. (3) Unlike the NPV or the IRR, which tell us how much wealth a project adds or how much a project’s rate of return exceeds the cost of capital, the payback merely tells us how long it takes to recover our investment. There is no necessary relationship between a given payback period and investor wealth, so we don’t know how to specify an acceptable payback. The firm might use 2 years, 3 years, or any other number as the minimum acceptable payback, but the choice is arbitrary.
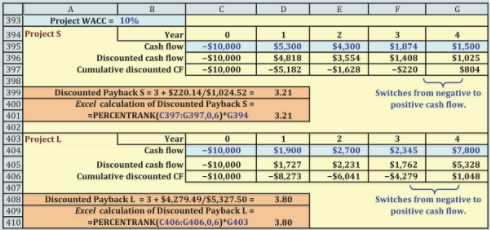
To counter the first criticism, financial analysts developed the discounted payback, where cash flows are discounted at the WACC and then those discounted cash flows are used to find the payback. In the Figure below, we calculate the discounted paybacks for S and L, assuming both have a 10% cost of capital. Each inflow is divided by (1 + r)t = (1.10)t, where t is the year in which the cash flow occurs and r is the project’s cost of capital, and then those PVs are used to find the payback. Project S’s discounted payback is 3.21 years and L’s is 3.80 years.
Note that the payback is a “break-even” calculation in the sense that if cash flows come in at the expected rate, then the project will at least break even. However, because the regular payback doesn’t consider the cost of capital, it doesn’t specify the true break-even year. The discounted payback does consider capital costs, but it disregards cash flows poor decisions. Finally, there is no way to determine how short the payback periods must be to justify accepting a project.
Although the payback methods have faults as ranking criteria, they do provide information about liquidity and risk. The shorter the payback, other things held constant, the greater the project’s liquidity. This factor is often important for smaller firms that don’t have ready access to the capital markets. Also, cash flows expected in the distant future are generally riskier than near-term cash flows, so the payback period is also a risk indicator.
Last modified: Tuesday, August 14, 2018, 8:51 AM