Reading: Lesson 3 - Analysis and Revision of Preliminary Plan & Additional Funds Needed Equation Method
10.3.A - Analysis and Revision of Preliminary Plan & Additional Funds Needed Equation Method
1. Analysis and Revision of the Preliminary Plan
- After explaining the process used to forecast the statements in the previous Figure, MicroDrive’s CFO constructed a 5-year forecast based on the methods and assumptions of the 1-year forecast. Important inputs and key results are shown in the Figure below.
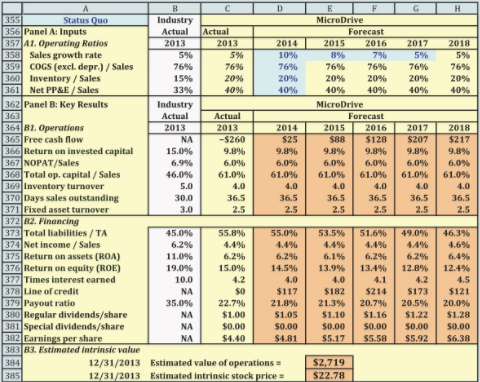
Section B1 of the Figure above shows key results from the operating plan for the Status Quo scenario. The good news is that FCF becomes positive, but the bad news is that the return on invested capital is much lower than the industry average and is lower than MicroDrive’s cost of capital. Rows 367 and 368 show that MicroDrive has a lower NOPAT/Sales ratio than its peers and a higher Capital/Sales ratio. In other words, MicroDrive is less profitable and less efficient. Rows 369–371 show that MicroDrive carries too much inventory, collects more slowly from its customers, and utilizes its factories inefficiently.
The financial plan reflects the poor operating performance. The projected ratio of total liabilities to sales shows that MicroDrive will have more leverage than its peers and will need to borrow from the expensive line of credit. However, even higher leverage is not enough to boost MicroDrive’s return on equity to the industry average. The poor performance also is reflected in MicroDrive’s estimated intrinsic stock value of $22.78, which is less than the current market price of $27. The management team concluded that unless they make changes soon, the market price will fall.
2. The Final Plan
- The marketing and sales directors made the first suggestion. They felt they could boost sales growth to 12% in the next year and maintain sales growth of 6% in the post-forecast years. However, when the CFO input higher sales growth rates and left all other inputs unchanged, the intrinsic value fell by a small amount. The CFO explained that MicroDrive’s return on invested capital was slightly lower than its cost of capital, so each additional dollar of sales is like adding a project that has small negative NPV.1 Unless MicroDrive improves its ROIC, growth will not add value.
- After much discussion, the management team concluded that, because of licensing fees and other costs, it was not feasible for the MicroDrive to reduce its COGS/Sales ratio in the next year. However, the director of R&D explained that the new products in the pipeline will have higher profit margins. If MicroDrive can fund some extra field tests, the new products can reach the market in a year and drive the ratio of COGS/Sales down to 75%.
- The production, sales, and purchasing managers are jointly responsible for inventory in MicroDrive’s supply chain. With some additional funding for technology to improve channels of information among suppliers and customers, MicroDrive can reduce inventory levels without hurting product availability. They estimated that the improved technology would push the Inventory/Sales ratio down to 17%.
- The production and human resource managers stated that productivity could be increased with new training programs so that employees can better utilize the new production equipment that had been added the previous year. They estimated that the increased productivity would cause the ratio of PP&E/Sales to fall to 36% in the next two years.
- Managers from accounting and finance estimated that the total cost for these improvement programs would be about $200 million.
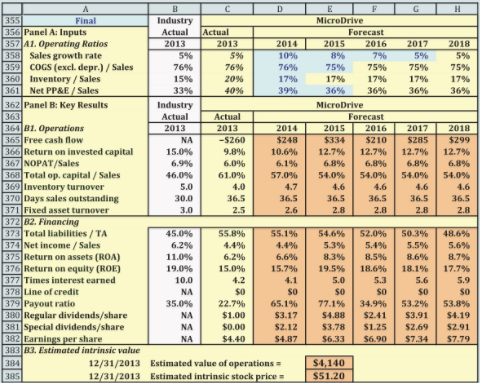
- The CFO entered these new inputs (except the cost to implement the new plans) into the model and named it the Final scenario. The results are shown in the Figure below. The value of operations increased from $3,814 million to $5,260 million. This is an increase of over $1.4 billion, well above the $200 million cost to implement the plans. Although the Final plan from the management retreat does not include the costs to implement the improvement plans, the CFO included these costs upon returning to headquarters.
3. Additional Funds Needed (AFN) Equation Method
- A complete financial plan includes projected financial statements, but the additional funds needed (AFN) equation method provides a simple way to get a ballpark estimate of the additional external financing that will be required. The AFN approach identifies the financing surplus or deficit in much the same way as we did in the previous sections: (1) Identify the amount of additional funding required by the additional assets due to growth in sales. (2) Identify the amount of spontaneous liabilities (which reduces the amount of external financing that is required to support the additional assets). (3) Identify the amount of funding generated internally from net income that will be available for reinvestment in the company after paying dividends. (4) Assume no new external financing (similar to the preliminary financial policy in the Status Quo scenario). The difference between the additional assets and the sum of spontaneous liabilities and reinvested net income is the amount of additional financing needed from external sources. Following are explanations and applications of these steps.
- In a steady-state situation in which no excess capacity exists, the firm must have additional plant and equipment, more delivery trucks, higher inventories, and so forth if sales are to increase. In addition, more sales will lead to more accounts receivable, and those receivables must be financed from the time of the sale until they are collected. Therefore, both fixed and current assets must increase if sales are to increase. Of course, if assets are to increase, liabilities and equity must also increase by a like amount to make the balance sheet balance.
- The first sources of expansion funding are the “spontaneous” increases that will occur in MicroDrive’s accounts payable and accrued wages and taxes. The company’s suppliers give it 10 days to pay for inventory purchases, and because purchases will increase with sales, accounts payable will automatically rise. For example, if sales rise by 10%, then inventory purchases will also rise by 10%, and this will cause accounts payable to rise spontaneously by the same 10%. Similarly, because the company pays workers every 2 weeks, more workers and a larger payroll will mean more accrued wages payable. Finally, higher expected income will mean more accrued income taxes, and its higher wage bill will mean more accrued withholding taxes. Normally no interest is paid on these spontaneous funds, but their amount is limited by credit terms, contracts with workers, and tax laws. Therefore, spontaneous funds will thus be used to the extent possible, but there is little flexibility in their usage.
- The second source of funds for expansion comes from net income. Part of MicroDrive’s profit will be paid out in dividends, but the remainder will be reinvested in operating assets, as shown in the Assets section of the balance sheet; a corresponding amount will be reported as an addition to retained earnings in the Liabilities and equity section of the balance sheet. There is some flexibility in the amount of funds that will be generated from new reinvested earnings because dividends can be increased or decreased, but if the firm plans to hold its dividend steady or to increase it at a target rate, as most do, then flexibility is limited.
- If we start with the required new assets and then subtract both spontaneous funds and additions to retained earnings, we are left with the additional funds needed, or AFN. The AFN must come from external sources; hence it is sometimes called EFN. The typical sources of external funds are bank loans, new long-term bonds, new preferred stock, and newly issued common stock. The mix of the external funds used should be consistent with the firm’s financial policies, especially its target debt ratio.
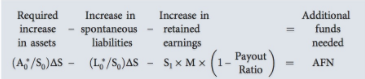
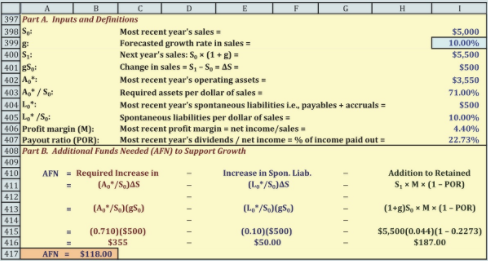
- The Equation below summarizes the logic underlying the AFN equation method. The Figure below defines the notation in the Equation below and applies it to identify MicroDrive’s AFN. The additional funds needed (AFN) equation is:
We see from Part B of the Figure below that for sales to increase by $500 million, MicroDrive must increase assets by $355 million. Therefore, liabilities and capital must also increase by $355 million. Of this total, $50 million will come from spontaneous liabilities, and another $187 million will come from new retained earnings. The remaining $118 million must be raised from external sources—probably some combination of short- term bank loans, long-term bonds, preferred stock, and common stock. Notice that the AFN from this model is very close to the surplus financing required in the Status Quo model for the projected financial statements because both methods assume that the operating ratios for MicroDrive will not change.
The AFN equation shows that external financing requirements depend on five key factors.
1. Sales growth (g). Rapidly growing companies require large increases in assets and a corresponding large amount of external financing, other things held constant.
2. Capital intensity (A0*/S0). The amount of assets required per dollar of sales, A0*/S0, is the capital intensity ratio, which has a major effect on capital requirements. Companies with relatively high assets-to-sales ratios require a relatively large number of new assets for any given increase in sales; hence they have a greater need for external financing. If a firm can find a way to lower this ratio—for instance, by adopting a just-in- time inventory system, by going to two shifts in its manufacturing plants, or by outsourcing rather than manufacturing parts—then it can achieve a given level of growth with fewer assets and thus less new external capital.
3. Spontaneous liabilities-to-sales ratio (L0*/S0). If a company can increase its spontaneously generated liabilities, this will reduce its need for external financing. One way of raising this ratio is by paying suppliers in, say, 20 days rather than 10 days. Such a change may be possible but, as we shall see in Chapter 16, it would probably have serious adverse consequences.
4. Profit margin (M = Net Income/Sales). The higher the profit margin, the more net income is available to support increases in assets—and hence the less the need for external financing. A firms’ profit margin is normally as high as management can get it, but sometimes a change in operations can boost the sales price or reduce costs, thus raising the margin further. If so, this will permit a faster growth rate with less external capital.
5. Payout ratio (POR = DPS/EPS). The less of its income a company distributes as dividends, the larger its addition to retained earnings—hence the less its need for external capital. Companies typically like to keep their dividends stable or to increase them at a steady rate—stockholders like stable, dependable dividends, so such a dividend policy will generally lower the cost of equity and thus maximize the stock price. So even though reducing the dividend is one way a company can reduce its need for external capital, companies generally resort to this method only if they are under financial duress.One interesting question is: “What is the maximum growth rate the firm could achieve if it had no access to external capital?” This rate is called the self-supporting growth rate, and it can be found as the value of g that, when used in the AFN equation, results in an AFN of zero. We first replace ΔS in the AFN equation with gS0 and S1with (1+g)S0 so that the only unknown is g; we then solve for g to obtain the following equation for the self supporting growth rate:

The definitions of the terms used in this equation are shown in the Figure above. If the firm has any positive earnings and pays out less than 100% in dividends, then it will have some additions to retained earnings, and those additions could be combined with spontaneous funds to enable the company to grow at some rate without having to raise external capital. For MicroDrive, the self supporting growth rate is 5.9%; this means it could grow at that rate even if capital markets dried up completely, with everything else held constant.
Last modified: Tuesday, August 14, 2018, 8:52 AM