Reading: Lesson 4 - Dividends versus Stock Repurchases
11.4.A - Dividends versus Stock Repurchases
1. Dividends versus Stock Repurchases
- Benson Conglomerate, a prestigious publishing house with several Nobel laureates among its authors, recently began generating positive free cash flow and is analyzing the impact of different distribution policies. Benson anticipates extremely stable cash flows and will use the residual model to determine the level of distributions, but it has not yet chosen the form of the distribution. In particular, Benson is comparing distributions via dividends versus repurchases and wants to know the impact the different methods will have on financial statements, shareholder wealth, the number of outstanding shares, and the stock price.
- Consider first the case in which distributions are in the form of dividends. The Figure below shows the most recent financial statements and the inputs we will use to forecast its financial statements. The forecasted financial statements for the next two years are shown in the Figure. Benson has no debt, so its interest expense is zero.
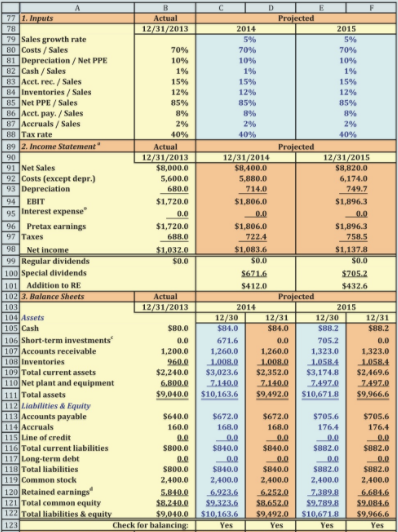
- Section 4 of the Figure above shows the identification and elimination of any financing deficit or surplus. The increase in financing is the sum of the increase in spontaneous financing (the sum of accounts payable and accruals), external financing (the increase in long-term debt and common stock), and internal financing (net income less any regular dividends); also, we subtract any beginning of year balance for the line of credit because Benson must pay off the line of credit each year even if it draws on it the next year. The increase in operating assets is the increase in all assets except the short-term investments. We subtract the increase in operating assets from the increase in financing. If the difference is negative, there is a financing deficit that must be met by drawing on the line of credit. If the difference is positive, there is a financing surplus that will be used by paying a special dividend.
- We show balance sheets in the Figure above for both December 30 and 31 of each year to better illustrate the impact of the distribution, which we assume occurs once each year on December 31.20 We assume that the financing surplus is temporarily used to purchase short-term investments that are held until the distribution to shareholders. At the time of the distribution, all short-term investments will be converted to cash and paid out as special dividends. Thus, the 2014 short-term investments total $671.6 on December 30 and drop to zero on December 31, when they are distributed to investors.21 Observe that the retained earnings account also drops by $671.6 on December 31 as funds that were previously retained are paid out as dividends.
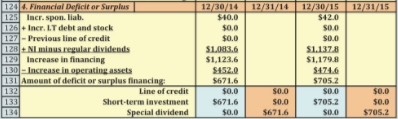
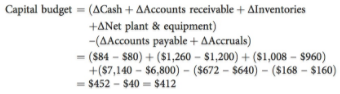
- Now let’s consider the case of stock repurchases. The projected income statements and asset portion of the balance sheets are the same whether the distribution is in the form of dividends or repurchases, but this is not true for the liabilities-and-equity side of the balance sheet. The Figure below reports the case in which distributions are in the form of stock repurchases. As in the case of dividend distributions, the December 30 balance of the retained earnings account is equal to the previous retained earnings balance plus the year’s net income, because all income is retained. However, when funds in the short-term investments account are used to repurchase stock on December 31, the repurchase is shown as a negative entry in the treasury stock account.
To summarize, the projected income statements and assets are identical whether the distribution is made in the form of dividends or stock repurchases. There also is no difference in liabilities. However, distributions as dividends reduce the retained earnings account, whereas stock repurchases reduce the treasury stock account.
2. The Residual Distribution Model
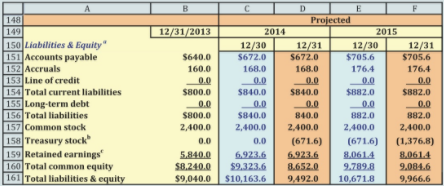
- The Figures above illustrate the residual distribution model in the Equation below as applied to entire financial statements. The projected capital budget is equal to the net addition to total operating capital from the projected balance sheets in the Figure above. For example, for 2014 the capital budget is:
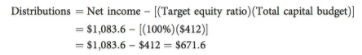
With a 100% target equity ratio and net income of $1,083.6, the residual distribution is:
3. The Impact of Distributions on Intrinsic Value
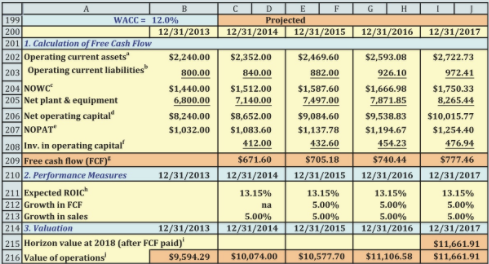
- We begin by calculating expected free cash flows and performance measures as shown in the Figure below. Notice that Benson’s expected return on invested capital is greater than the cost of capital, indicating that the managers are creating value for their shareholders. Also notice that the company is beyond its high-growth phase, so FCF is positive and growing at a constant rate of 5%. Therefore, Benson has cash flow available for distribution to investors.
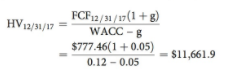
The Figure above also shows the horizon value at 2017, which is the value immediately after the payment of the FCF at 2017—it is the value of all FCF from 2018 and beyond discounted back to 12/31/2017. We can use the projected FCFs to determine the horizon value at the end of the projections and then estimate the value of operations for each year prior to the horizon. For Benson, the horizon value on December 31, 2017, is:
The value of operations at 12/31/2017 is the present value of all FCF from 2018 and beyond discounted back to 12/31/2017, which is exactly the definition of the horizon value at 12/31/2017. Therefore, the value of operations at 12/31/2017 is $11,661.9.
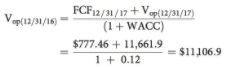
To estimate the value of operations at dates prior to the horizon, consider the following logic. Suppose you own the operations at 12/31/2016 and have just received the 2016 FCF. You plan to sell the operations in a year, after receiving the 2017 FCF. Your expected cash flows in 1 year would be the 2017 FCF and the value at which you expect to sell the operations on 12/31/2017. What is the expected sales price of the operations at 12/31/17? It is the value of all cash flows in 2018 and beyond, discounted back to 12/31/2017, which is the definition of the previously calculated value of 12/31/2017 value of operations. Therefore, the value of operations on 12/31/2016 (after the 2016 FCF has been paid) is the sum of the 12/31/2017 FCF and value of operations, discounted back 1 year at the WACC:
We can repeat this process to obtain the current value of operations (i.e., as of December 31, 2013): $9,549.29.
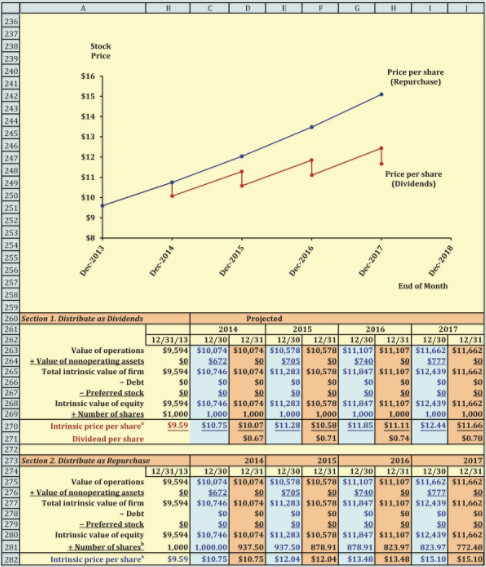
4. The Intrinsic Stock Price: Distributions as Dividends
- The Figure below shows the intrinsic stock price each year using the corporate valuation approach. Section 1 provides calculations assuming cash is distributed via dividends. Notice that on December 31 the intrinsic value of equity drops because the firm no longer owns the short-term investments. This causes the intrinsic stock price also to drop. In fact, the drop in stock price is equal to the dividend per share. For example, the 2014 dividend per share (DPS) is $0.67 and the drop in stock price is $10.75 − $10.07 = $0.68 ≈ $0.67. (The penny difference here is due to rounding in intermediate steps.)
- Notice that if the stock price did not fall by the amount of the DPS, then there would be an opportunity for arbitrage. If the price were to drop by less than the DPS—say, by $0.50 to $10.25, then you could buy the stock on December 30 for $10.75, receive a DPS of $0.67 on December 31, and then immediately sell the stock for $10.25, reaping a sure profit of −$10.75 + $0.67 + $10.25 = $0.17. Of course, you’d want to implement this strategy with a million shares, not just a single share. But if everyone tried to use this strategy, the increased demand would drive up the stock price on December 30 until there was no more sure profit to be made. The reverse would happen if investors expected the stock price to fall by more than the DPS.
- Here is an important observation: Even though the stock price falls, shareholder wealth does not fall. For example, on December 30, a shareholder owns stock worth $10.75. On December 31, the shareholder owns stock worth $10.07 but has cash of $0.67 from the dividend, for total wealth of $10.75 (subject to rounding differences). Thus, the shareholder’s wealth is the same before and after the dividend payment, with the only difference being that part of the shareholder’s wealth is in the form of cash from the dividend payment.
- Section 1 of the Figure above provides calculations of intrinsic value for the case in which stock is repurchased. Observe that the intrinsic value of equity is the same for both methods of distributions, but the analysis of a repurchase is a little more complicated because the number of shares changes. The key to solving this additional complexity is to recognize that the repurchase does not change the stock price. If the price did change due to the repurchase, then there would be an arbitrage opportunity. For example, suppose the stock price is expected to increase after the repurchase. If this were true, then it should be possible for an investor to buy the stock the day before the repurchase and then reap a reward the very next day. Current stockholders would realize this and would refuse to sell the stock unless they were paid the price that is expected immediately after the repurchase. Now suppose the stock price is expected to fall immediately after the repurchase. In this case, current shareholders should try to sell the stock prior to the repurchase, but their actions would drive the price down to the price that is expected after the repurchase. As you can see, the repurchase itself does not change the stock price.
- In summary, the events leading up to a repurchase generate cash (the sale of a division, a recapitalization, or the generation of high free cash flows from operations). Generating cash can certainly change the stock price, but the repurchase itself doesn’t change the stock price. We can use this fact to determine the number of shares repurchased. First, though, we must define some notation.
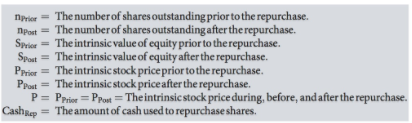
As we explained, the repurchase itself doesn’t change the stock price. Therefore, the number of shares repurchased is equal to the amount of cash used to repurchase stocks divided by the stock price:

Last modified: Tuesday, August 14, 2018, 8:54 AM