Reading: Lesson 1 - Capital Structure
12.1.A - Capital Structure
1. An Overview of Capital Structure
- Growth in sales requires growth in operating capital, and this often requires that external funds be raised through a combination of equity and debt. The firm’s mixture of debt and equity is called its capital structure. Although actual levels of debt and equity may vary somewhat over time, most firms try to keep their financing mix close to a target capital structure. A firm’s capital structure decision includes its choice of a target capital structure, the average maturity of its debt, and the specific types of financing it decides to use at any particular time. As with operating decisions, managers should make capital structure decisions that are designed to maximize the firm’s intrinsic value.
- The value of a firm’s operations is the present value of its expected future free cash flows (FCF) discounted at its weighted average cost of capital (WACC):

The WACC of a firm financed only by debt and common stock depends on the percentages of debt and common stock (wd and ws), the cost of debt (rd), the cost of stock (rs), and the corporate tax rate (T):

As these equations show, the only way any decision can change the value of operations is by changing either expected free cash flows or the cost of capital. As you read the unit, think about the ways the capital structure choices can affect FCF or the WACC.
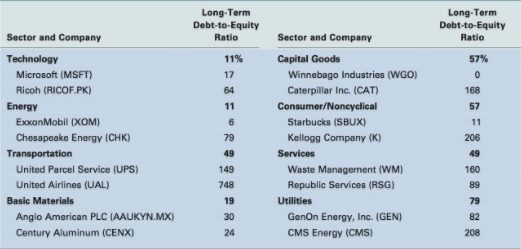
For the average company in the S&P 500, the ratio of long-term debt to equity was about 108% in the spring of 2012. This means that the typical company had about $1.08 in debt for every dollar of equity. However, the Table below shows that there are wide divergences in the average ratios for different business sectors and for different companies within a sector. For example, the technology sector has a very low average ratio (11%) while the utilities sector has a much higher ratio (79%). Even so, within each sector there are some companies with low levels of debt and others with high levels. For example, the average debt ratio for the consumer/noncyclical sector is 57%, but in this sector Starbucks has a ratio of 11% while Kellogg has a ratio of 206%. Why do we see such variation across companies and business sectors? Can a company make itself more valuable through its choice of debt ratio?
Last modified: Tuesday, August 14, 2018, 8:54 AM