Reading: Lesson 5 - Estimating the Optimal Capital Structure
12.5.A - Estimating the Optimal Capital Structure
1. The Current Value and Capital Structure of Strasburg
- Managers should choose the capital structure that maximizes shareholders’ wealth. The basic approach is to consider a trial capital structure, based on the market values of the debt and equity, and then estimate the wealth of the shareholders under this capital structure. This approach is repeated until an optimal capital structure is identified. There are several steps in the analysis of each potential capital structure: (1) Estimate the interest rate the firm will pay. (2) Estimate the cost of equity. (3) Estimate the weighted average cost of capital. (4) Estimate the value of operations, which is the present value of free cash flows discounted by the new WACC. The objective is to find the amount of debt financing that maximizes the value of operations. As we will show, this capital structure maximizes both shareholder wealth and the intrinsic stock price. The following sections explain each of these steps, using the company we considered earlier, Strasburg Electronics.
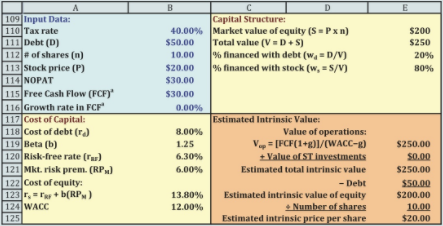
- In an earlier Section, Strasburg was examining several different capital structure plans. Strasburg implemented Plan L, the one with high operating leverage and $50 million in debt financing. The plan has been in place for a year, and Strasburg’s stock price is now $20 per share. With 10 million shares, Strasburg’s market value of equity is $20(10) = $200 million. Strasburg has no short-term investments, so Strasburg’s total enterprise value is the sum of its debt and equity: V = $50 + $200 = $250 million. In terms of market values, Strasburg’s capital structure has 20% debt (wd = $50/$250 = 0.20) and 80% equity (ws = $200/$250 = 0.80). These calculations are reported in the Figure below along with other input data.
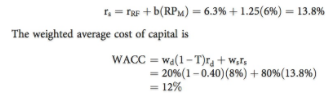
- Is this the optimal capital structure? We will address the question in more detail later, but for now let’s focus on understanding Strasburg’s current valuation, beginning with its cost of capital. Strasburg has a beta of 1.25. We can use the Capital Asset Pricing Model (CAPM) to estimate the cost of equity. The risk-free rate, rRF, is 6.3% and the market risk premium, RPM, is 6%, so the cost of equity is
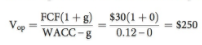
Plan L has a NOPAT of $30 million. Strasburg expects zero growth, which means there are no required investments in capital. Therefore, FCF is equal to NOPAT. Using the constant growth formula, the value of operations is:
The Figure below illustrates the calculation of the intrinsic stock price. For Strasburg, the intrinsic stock price and the market price are each equal to $20. Can Strasburg increase its value by changing its capital structure?
2. Estimating the Weighted Average Cost of Capital (WACC) for Different Levels of Debt
- The CFO asked Strasburg’s investment bankers to estimate the cost of debt at different capital structures. The investment bankers began by analyzing industry conditions and prospects. They appraised Strasburg’s business risk based on its past financial statements and its current technology and customer base. The bankers also forecasted financial statements with different capital structures and analyzed such key ratios as the current ratio and the times-interest- earned ratio. Finally, they factored in current conditions in the financial markets, including interest rates paid by firms in Strasburg’s industry. Based on their analysis and judgment, they estimated interest rates at various capital structures as shown in Row 2 of the Figure below, starting with a 7.7% cost of debt for the first dollar of debt. This rate increases to 16% if the firm finances 60% of its capital structure with debt. Strasburg’s current situation is in Column D and is shown in blue.
- An increase in the debt ratio also increases the risk faced by shareholders, and this has an effect on the cost of equity, rs. Recall that a stock’s beta is the relevant measure of risk for diversified investors. Moreover, it has been demonstrated, both theoretically and empirically, that beta increases with financial leverage. The Hamada equation specifies the effect of financial leverage on beta:

Here D is the market value of the debt and S is the market value of the equity. The Hamada equation shows how increases in the market value debt/equity ratio increase beta. Here bU is the firm’s unlevered beta coefficient—that is, the beta it would have if it had no debt. In that case, beta would depend entirely on business risk and thus be a measure of the firm’s “basic business risk.”
Sometimes it is more convenient to work with the percentages of debt and equity at which the firm is financed (wd and ws) rather than the dollar values of D and S. Notice that wd and ws are defined as D/(D + S) and S/(D + S), respectively. This means that the ratio wd/ws is equal to the ratio D/S. Substituting these values gives us another form of Hamada’s formula:

Often we know the current capital structure and beta but wish to know the unlevered beta. We find this by rearranging the Equation as follows:

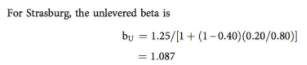
Using this unlevered beta, we can then apply Hamada’s formula in the Equation above to determine estimates of Strasburg’s beta for different capital structures. These results are reported in Line 3 of Figure above.
Recall that the risk-free rate is 6.3% and the market risk premium is 6%. We can use the CAPM and the previously estimated betas to estimate Strasburg’s cost of equity for different capital structures (which cause Strasburg’s beta to change). These results are shown in Line 4 of the Figure above. As expected, Strasburg’s cost of equity increases as its debt increases. The Figure above graphs Strasburg’s required return on equity at different debt ratios. Observe that the cost of equity consists of the 6.3% risk-free rate, a constant premium for business risk in the amount of RPM(bU) = 6.522%, and a premium for financial risk in the amount of RPM(b − bU) that starts at zero (because b = bU for zero debt) but rises at an increasing rate as the debt ratio increases.
Line 6 of the Figure above shows Strasburg’s weighted average cost of capital, WACC, at different capital structures. As the debt ratio increases, the costs of both debt and equity rise, at first slowly but then at an accelerating rate. Eventually, the increasing costs of these two components offset the fact that more debt (which is still less costly than equity) is being used. At 40% debt, Strasburg’s WACC hits a minimum of 11.63%; Column F is the capital structure with the minimum WACC. Notice that the WACC begins to increase for capital structures with more than 40% debt. The Figure below shows how the WACC changes as debt increases.
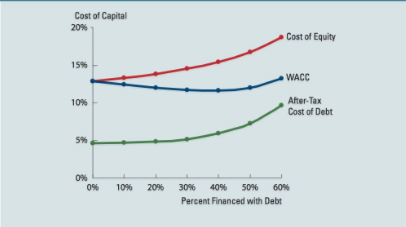
Also note that, even though the component cost of equity is always higher than that of debt, only using debt would not maximize value. If Strasburg were to issue more than 40% debt, then the costs of both debt and equity would increase in such a way that the overall WACC would increase, because the cost of debt would increase by more than the cost of equity.
3. Estimating the Firm’s Value
- As we showed previously, Strasburg currently has a $250 million intrinsic value of operations: wd = 20%, WACC = 12%, FCF = $30 million, and zero growth in FCF. We can use the data in the Figure above to estimate Strasburg’s value of operations at different capital structures; these results are reported in Line 7 of the Figure above and are graphed in the Figure below. The maximum value of $257.86 million occurs at a capital structure with 40% debt, which also is the capital structure that minimizes the WACC.
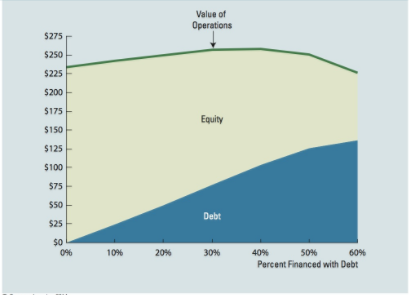
The Figures above also show the values of debt and equity for each capital structure. The value of debt is found by multiplying the value of operations by the percentage of the firm that is financed by debt: Debt = wd × Vop. The intrinsic value of equity is found in a similar manner: S = Vop − Debt = ws × Vop. Even though the intrinsic value of equity falls as debt increases, the wealth of shareholders is maximized at the maximum value of operations.
Last modified: Tuesday, August 14, 2018, 8:55 AM