Reading: Lesson 6 - Understanding and Using Basic Statistics
7.6.A - Understanding and Using Basic Statistics
1. UNDERSTANDING NUMERICAL INFORMATION
- Using data in decision making involves much more than adding, subtracting, multiplying, and dividing. Numerical information provides evidence to help managers understand what works and what does not work. Managers learn from the careful study and interpretation of data. They make better decisions as a result.
- Making decisions may be one of the most challenging responsibilities faced by managers. Decisions involve risks and unknowns. Most decisions have consquences. In some cases, the future success of a company and its employees may depend on a decision. Other decisions may not be as important, but still have an impact. The careful and objective use of data is the most effective way to improve management decision making. Managers frequently use statistics to help them understand, interpret, communicate, and apply numerical information. By using statistics, managers can make decisions more quickly, with greater confidence, and with a higher probability that the best choice has been made. It would be nice if every decision came down to simple, correct and incorrect choices, or simple answers of “yes” or “no.” In reality, the decision-making process reveals several options. It is often difficult to evaluate the options to determine the best choice. The effective use of statistics helps the decision maker remain objective. There is no benefit in making a decision and later searching for data to support that decision. Managers must keep an open mind when a problem is identified or a question is asked. Information needs to be collected, organized, studied, and analyzed. The manager examines information carefully and objectively to determine if there is evidence to support one choice or another. Statistics help direct the manager to the best available solution or answer.
- Managers face two very different types or situations that call for decisions. The most common is making decisions about current operations. Nancy is the regional manager for a chain of department stores. She is concerned about the differences in the volume of sales generated from each of the stores in her region during the most recent quarter. She wants to study information that may help her decide how to divide new inventory among the stores. Nancy gets daily sales reports from each store. Those sales are totaled and summarized each week, month, and quarter. Gathered with her assistant managers, she says, “We need to know more about the sales results. What is the greatest percentage of increase and decrease among all the stores? Of the stores that had increased sales, what was the average dollar volume increase?” Nancy and her assistants will use descriptive statistics to examine the sales information.
- Descriptive statistics provide meaningful summaries of data to help managers understand the current situation. The managers want to identify factors that contribute to increases and decreases in sales in order to improve the performance of all stores and to make sure the stores with increased sales will have enough inventory for the upcoming sales period. The second situation facing managers is using available information to improve future decisions about similar circumstances. Filipe is a product manager for a large consumer products company. He and his team are beginning to review all of the data from a three-month introduction of a new sunscreen product that is applied using disposable towelettes. The product was introduced in two markets. The team needs to determine whether to expand sales and which additional markets have the greatest potential. As they start through the data, Filipe asks, “What percentage of the total market for sunscreen products were we able to capture from our competitors in the three months? How did sales vary based on the age, gender, and income of the customer? What similarities and differences were there between the two markets? Most of the questions Filipe is asking will be answered with inferential statistics. Inferential statistics use the analysis of information to make predictions about similar circumstances or about the future. Filipe’s team wants to use the information gathered during the market test to determine how to expand the sales of the new sunscreen product.
2. STATISTICS TERMS AND CONCEPTS
- Many managers do not actually conduct research or complete the statistical analysis. They receive reports that present the results of data collection and analysis. Managers must be able to read and understand the reports and use the information to make decisions. That understanding starts with recognizing important terms and concepts that are a part of descriptive and inferential statistics.
- and want to understand it better. Organizing the data using descriptive statistics will make it easier to examine important components of the information being studied and to determine if any meaningful relationships exist. The first step in using descriptive statistics is to identify the important characteristics of the data set. A data set is all of the data that have been collected for study. Characteristics (also known as variables) are the unique, identifiable qualities or features of the people or objects being studied. If a company’s customers are being studied, all of the relevant customer information that has been collected is the data set. Important characteristics might be age, gender, income level, number of years as a customer, and types of products purchased. A study of employees might focus on job titles, department, years employed, hours of training received, and job performance rating. Research on a company’s products may look at type of product, factory where production occurred, units sold, and dollar sales volume.
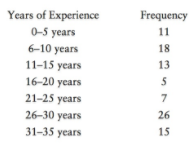
- When important characteristics have been identified, the data are then classified. Data collected for each characteristic will fall within a range of numbers. A range is all of the possible values of a characteristic from lowest to highest. For example, Perlich Industries has 95 employees with work experience ranging from 1 to 35 years. The complete data set for the years of experience of all 95 employees appears below.
1, 1, 1, 3, 4, 4, 4, 5, 5, 5, 5, 6, 6, 6, 7, 7, 8, 8, 8, 8, 8, 9, 9, 9, 9, 9, 10, 10, 10, 11, 11, 12, 12, 13, 13, 13, 13, 13, 13, 13, 14, 15, 16, 16, 17, 18, 18, 21, 21, 22, 24, 25, 25, 25, 26, 26, 26, 26, 26, 27, 27, 27, 27, 27, 27, 27, 27, 27, 27, 28, 28, 28, 28, 29, 29, 29, 30, 30, 30, 30, 31, 31, 31, 32, 32, 32, 33, 33, 33, 33, 34, 34, 35, 35, 35 - When data are classified, they are organized within meaningful categories for further analysis. One common classification of data in research is the frequency distribution. A frequency distribution lists each of the values in the range for a characteristic and the number of times that value appears in the data set. For example, the data for Perlich Industries can be classified into categories representing five-year groupings of experience. It is much easier to study the years of experience of the employees when the data are organized in a frequency distribution rather than a list of 95 numbers. The frequency distribution for the Perlich data appears below.
It may also be helpful to know what value represents the average, or most common, of all the data. In statistics, an average value is called a measure of central tendency. There are three different averages commonly used in statistics: the mean, median, and mode. The mean is the sum of all values divided by the number of values. The median is the middle number in the range of all the values. The mode is the value that appears the most frequently in the range. When the three measures of central tendency are calculated on the complete data set for the 95 employees described earlier, the mean is 19.07 years, the median is 21 years, and the mode is 27 years. Decision makers may also analyze data in terms of groupings to ascertain how different segments may be performing. For instance, a manager might want to know about order sizes and, thus, break sales data into quartiles. Quartiles take a specific characteristic—such as average sales—and allow a decision maker to draw focus to broad groups. For instance, if a retailer finds that one- fourth of all sales transactions are less than $5 (first quartile) but also learns that one-fourth of all sales transactions are greater than $250 (fourth quartile), the company would benefit from providing more services to those customers placing the largest orders.
Descriptive statistics are used to describe and analyze all of the subjects or objects being studied. Inferential statistics, on the other hand, are a bit more complex. Using inferential statistics, a manager can use a small amount of information to draw conclusions about a larger group, to compare two groups to determine similarities and differences on important characteristics, or to use existing information to make predictions about the future. To infer means to draw a conclusion with only partial information. With inferential statistics, a manager draws a conclusion about a population based on a sample. The population is all of the people or objects with a similar characteristic or characteristics being studied. The sample is a small, representative part of a population selected for study. For instance, all attendees at a specific sporting event would be the population, while a smaller group of fans—the sample— might be surveyed to talk about the experience.
When decision makers review data from a sample, there is a chance that the results are not the same as they would have been if the entire population had been studied. They need to know the probability that the results represent the population. A probability is the likelihood that a certain outcome will occur. Inferential statistics are also used to identify possible correlations. A correlation is a connection or relationship between two things being studied. Filipe and his team will use inferential statistics when they evaluate the new sunscreen product and make decisions about its future. Information was gathered from two test markets. All of the customers in those markets make up the population being studied, but information is not needed from every customer. A sample of customers can be used as long as those in the sample have characteristics representative of the population. The new product team will review evidence from the test market to determine the probability that the results obtained in the test market can be obtained in other markets the company enters in the future. They will look for evidence of factors in the test market that appears to be correlated with positive sales results. Those factors should be effective in any new markets that are similar to the test markets.
Last modified: Tuesday, August 14, 2018, 8:21 AM