Reading: Lesson 3 - Financial Reports
8.3.A - Financial Reports
1. FINANCIAL STATEMENTS
- Business activity is in large part measured in terms of money. The amount of money a business earns, its level of profitability, and the return received by owners and others who are involved in financing the business are important measures of its success. Because of the importance of the financial performance and financial condition of businesses, every business must (1) keep thorough and accurate records, (2) prepare important financial reports regularly, (3) interpret the financial information in the reports, and (4) make decisions that will have a positive influence on future financial results.
- Financial statements are reports that summarize financial data over a period of time, such as a month, three months, half a year, or a full year. The two financial reports businesses use most are the balance sheet and the income statement. Each provides a specific view of the financial condition and financial performance of a business. Each is necessary in determining whether a business is being well managed. Financial reports have many uses in business, as shown in the Figure below. Executives use them as a means to effectively manage a profitable business. Suppliers, lenders, employee unions, government agencies, and owners also use financial reports when making decisions.
2. THE BALANCE SHEET
- A balance sheet, or statement of financial position, is a financial statement that reports a business’s assets, liabilities, and capital on a specific date. As you learned previously, assets are anything of value owned, such as cash and buildings. Liabilities are claims against assets. In other words, liabilities are the business’s debts. And capital (also called net worth, owner’s equity, or stockholders’ equity) is the value of the owners’ investment in the business after subtracting liabilities from assets. A balance sheet has two sides. Assets are listed and totaled on the left. Liabilities and capital are listed and totaled on the right. The values of the two sides must always balance—thus the name. That is, the total of all assets must equal the total of all liabilities plus capital. In fact, the basic accounting equation is expressed as:
Each balance sheet has a heading that includes the name of the business, the title “Balance Sheet,” and the statement date. The information in the balance sheet presents a summary of the business’s financial position on the date in the heading. Balance sheets are prepared at least once a year and usually more frequently.
An example of a balance sheet for a jewelry store, the Crown Corporation, is shown in the Figure below. On December 31, the accountants for the Crown Corporation prepared a balance sheet. The value of every asset the business owns is listed under Assets. As shown in the figure, Crown’s total assets are $5,360,000. The company’s debts—items purchased on credit and the mortgage still owed on the land and building—are listed under Liabilities, which total $1,360,000. The accountants subtracted total liabilities from total assets to calculate Crown’s capital, $4,000,000. Crown purchases jewelry from a manufacturer and then resells it to customers. Until the jewelry is sold, it is listed as an asset called merchandise inventory. Merchandise inventory is the value of goods purchased to sell to customers at a profit. Crown Corporation sells merchandise on a cash or credit basis. For credit sales, the company allows approved customers to pay over time using the company’s credit card. The amount customers owe the business is an asset called accounts receivable. It is an asset because the business has a legal right to obtain cash for the goods sold and can sue customers who do not pay. The store expects to eventually collect cash from the customers. The accounts payable item under Liabilities on the balance sheet is the amount the company owes for purchases it made on credit. In this example, the store bought jewelry worth $320,000 on credit from suppliers. Until the company completes payment on the accounts, the amount owed remains on the balance sheet as a liability, or debt.
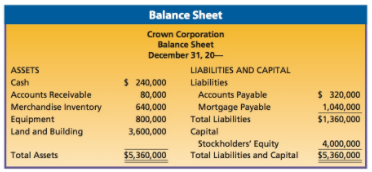
The balance sheet for the Crown Corporation provides a great deal of useful data. It lists specific types and amounts of assets and liabilities. The balance sheet also shows that the business owns assets of $5,360,000, owes $1,360,000, and is worth $4,000,000 on December 31. The total figures on the balance sheet agree with the basic accounting formula as follows:
A careful look at the specific items reveals other valuable information. For example, Crown cannot currently pay the $320,000 that it owes under accounts payable because it has only $240,000 in cash available. Ideally, the company will make enough cash sales and will collect payments from some of those customers listed under accounts receivable soon enough to pay its bills when due. Even though the money owed under accounts payable is not likely to become due all at once, the company could possibly have trouble meeting other day-to- day expenses. The company would be in trouble if a sudden emergency arose that called for a large amount of cash. Crown may use its balance sheet to compare financial results with prior time periods or with other companies. Because companies prepare a yearly balance sheet, the business can review its financial progress by comparing this year’s results with last year’s. It may find, for example, that the amount of capital increased over last year without an increase in liabilities. If Crown wished to do so, it could also compare some information on its balance sheet with that of other businesses of similar size and kind. Published information is available from several sources, such as trade associations. With comparative figures, the business can make judgments about its success and determine ways to improve its financial picture in the future.
3. THE INCOME STATEMENT
- The income statement, or profit and loss statement, is a financial statement that reports information about a company’s revenues and expenses for a specific period. Income statements are usually prepared monthly, quarterly, or semi-annually. An annual income statement is also needed. Income statements have three major parts:
1. Revenue—income earned for the period, such as from the sale of goods and services
2. Expenses—all costs incurred in operating the business, such as the cost of equipment and supplies, inventory, and wages.
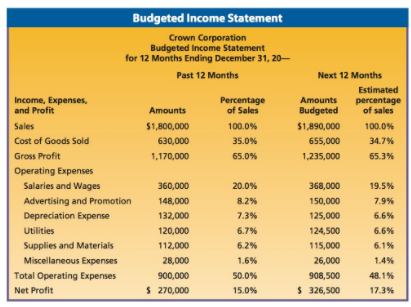
3. Profit or loss—the difference between total revenue and total expenses - When revenue is greater than expenses, the company has earned a profit. When expenses are greater than revenue, the company has incurred a loss. The income statement shows the financial performance (profit or loss) that occurs over a specified period of time. The balance sheet, on the other hand, shows the financial condition of a business at a particular point (date) in time. Both types of financial statements serve useful but different purposes. An example of an income statement appears in the Figure below. The period covered for the income statement of the Crown Corporation is one year, as shown in the heading.
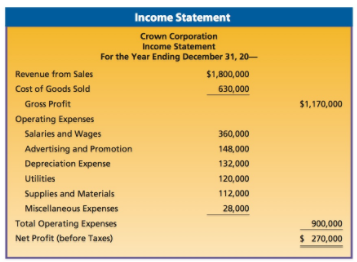
The revenue for the Crown Corporation comes from one source—the sale of jewelry. Total revenue for the year was $1,800,000. If the company earned other income, such as from the repair of jewelry, it would be listed separately under Revenue. To earn revenue, a retail business purchases merchandise from suppliers and sells it to customers at a profit. The amount the retailer pays the supplier for the merchandise it buys and sells is called cost of goods sold. In a manufacturing business, the cost of goods sold would include the amount the company paid for raw materials and parts to make its products.
Generally, the cost of goods sold is a rather large deduction from revenue. To make the cost of goods sold easy to identify on the income statement, it is listed separately from other deductions. Gross profit is the amount remaining after subtracting the cost of goods sold from revenue. Gross profit for the Crown Corporation is $1,170,000, which is calculated by subtracting the cost of goods sold ($630,000) from sales revenue ($1,800,000). Net profit is the amount remaining after subtracting all expenses from revenue, except taxes. Expenses needed to operate the business during the year are listed next on the income statement. Operating expenses are all expenses not directly associated with producing or purchasing merchandise the business sells. For example, businesses spend money on advertising, supplies, and maintenance. For Crown Corporation, operating expenses total $900,000. On the income statement, operating expenses are subtracted from gross profit, $1,170,000, to arrive at the net profit or “bottom line,” $270,000.
The net result of the business activity reported in the form of revenue, cost of goods sold, expenses, and profit on the income statement appears in one form or another on the balance sheet. For the Crown Corporation, the net profit of $270,000 will be added to its assets (left side of the balance sheet) and capital (right side of the balance sheet). Thus, the two sides of the balance sheet will still balance.
The top management of Crown Corporation, and others who review the income statement, can learn a great deal about the business. Specifically, the total deductions from the $1,800,000 in revenue are $1,530,000, which consists of cost of goods sold ($630,000) and operating expenses ($900,000). The manager can also see that the net profit before taxes—$270,000—is a rather small part of the total revenue. Businesses spend a great deal of their revenue to cover the cost to produce or purchase the products they sell and the expenses of operating the business. Losses or very low profits signal possible problems with costs and expenses. The Crown Corporation management can improve the company’s financial controlling and budget planning by doing an item-by-item analysis of the income statement, such as that shown in the first two columns of numbers in Figure below. Each expenditure can be calculated as a percentage of total sales. Managers can then compare the percentages with similar figures from prior months and years to reveal trends.
For instance, the first and largest operating expense is $360,000 for salaries and wages. When $360,000 is divided by total sales, $1,800,000, and the answer is changed to a percentage, the result is 20 percent. If last year the total wages and salaries expense amounted to only 18 percent of sales, the business would know that this expense had increased in relation to total sales. If possible, the company can try to correct this 2 percent increase for the next year by trying to increase sales, raise prices, or get by with fewer employees. The same type of calculation and analysis can be made for each of the remaining expenses on the income statement. In addition, managers can determine the percentages of gross profit and net profit in relation to sales. Based on that analysis, budgets can be prepared for the next 12 months, as shown in the last two columns of the Figure below. Managers can compare amounts and percentages for the past 12 months with the budgeted amounts and estimated percentages for the next 12 months.
4. THE CASH FLOW STATEMENT
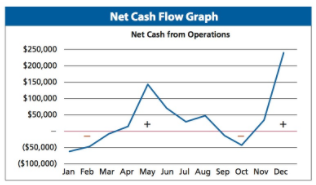
- A cash flow statement is a financial report that would primarily be used for internal control of cash. Cash flow is the movement of cash into and out of a business. Money comes in immediately as a result of the sale of goods and services for cash and later from sales made on credit. Money goes out to pay for various costs and operating expenses. Because money does not always flow in at the same rate that it flows out, managers need to carefully plan for the flow of cash. Regardless of the size of a business, cash is both a short-term and a long-term concern. Businesses must have cash on hand to pay bills when they are due and to plan ahead for large cash payments, such as the purchase of equipment or the launching of a new product.
- The bulk of Crown’s sales occur during the December holiday season. At the beginning of the calendar year, cash shortages are likely to occur. The need for cash is greatest during January, February, and March when sales slow and then again in September and October when the company buys inventory to sell. It needs large sums of cash to pay for the jewelry, for sales promotions such as advertising, and for regular operating expenses. The cash flowing out of the company for five months is greater than the cash flowing in.
- The Figure below shows that Crown starts the year with a cash deficit from operations. To cover this shortage, Crown borrows money from the bank to ensure it can cover cash needs. As sales pick up in the spring, Crown is able to repay its bank note (loan). Larger amounts of cash start to flow in from customers during the Christmas season. During these months, the flow of cash coming into the business will be greater than the cash going out. From this information, managers can plan for short-term borrowing during times of cash shortage. They can also plan when to make any needed large purchases, so that their payments will be due when they have cash available to pay them.
f
Last modified: Tuesday, August 14, 2018, 8:29 AM