Reading: Business Risk and Operating Leverage
Business
Risk and Operating Leverage
•Business
risk is the risk a firm’s common stockholders would face if the firm had no
debt.
•In
other
words, it is the risk inherent in the firm’s operations, which arises from
uncertainty about future operating profits and capital requirements. Business
risk depends on a number of factors, beginning with variability in product
demand and production costs.
•If
a
high percentage of a firm’s costs are fixed and hence do not decline when
demand falls, then the firm has high operating leverage, which increases its
business risk.
•A
high degree of operating leverage implies that a relatively small change in
sales results in a relatively large change in EBIT, net operating profits after
taxes (NOPAT), return on invested capital (ROIC), return on assets (ROA), and
return on equity (ROE).
•Other
things
held constant, the higher a firm’s fixed costs, the greater its operating
leverage. Higher fixed costs are generally associated with (1) highly
automated, capital intensive firms; (2) businesses that employ highly skilled
workers who must be retained and paid even when sales are low; and (3) firms
with high product development costs that must be maintained to complete ongoing
R&D projects.
•To
illustrate the relative impact of fixed versus variable costs, consider
Strasburg Electronics Company, a manufacturer of components used in cell
phones. Strasburg is considering several different operating technologies and
several different financing alter- natives. We will analyze its financing
choices in the next section, but for now we will focus on its operating plans.
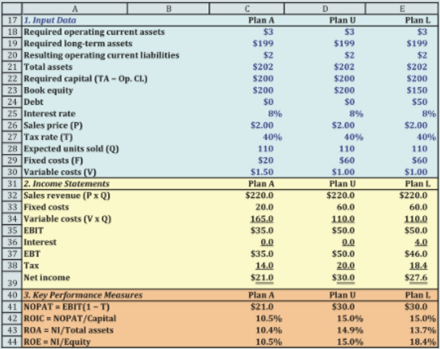
•Strasburg
is comparing two plans, each requiring a capital investment of $200 million;
assume for now that Strasburg will finance its choice entirely with equity.
Each plan is expected to produce 110 million units (Q) per year at a sales
price (P) of $2 per unit. Plan A’s technology requires a smaller annual
fixed cost (F) than Plan U’s, but Plan A has higher variable costs (V). (We
denote the second plan with U because it has no financial leverage, and we
denote the third plan with L because it does have financial leverage; Plan L is
discussed in the next section.) The projected income statements and selected
performance measures for the first year. Notice that Plan U’s performance
measures are superior to Plan A’s if the expected sales occur.
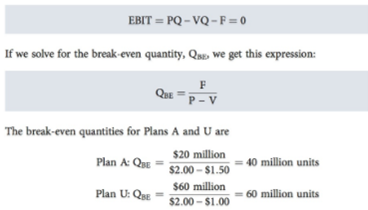
•Plan
A
will be profitable if unit sales are above 40 million, whereas Plan U requires
sales of 60 million units before it is profitable. This difference occurs
because Plan U has higher fixed costs, so more units must be sold to cover
these fixed costs. Panel a of the Figure below illustrates the operating
profitability of these two plans for different levels of unit sales. Because
these companies have no debt, the return on assets measures operating
profitability; we report ROA instead of EBIT to facilitate comparisons.
Last modified: Tuesday, August 14, 2018, 8:55 AM